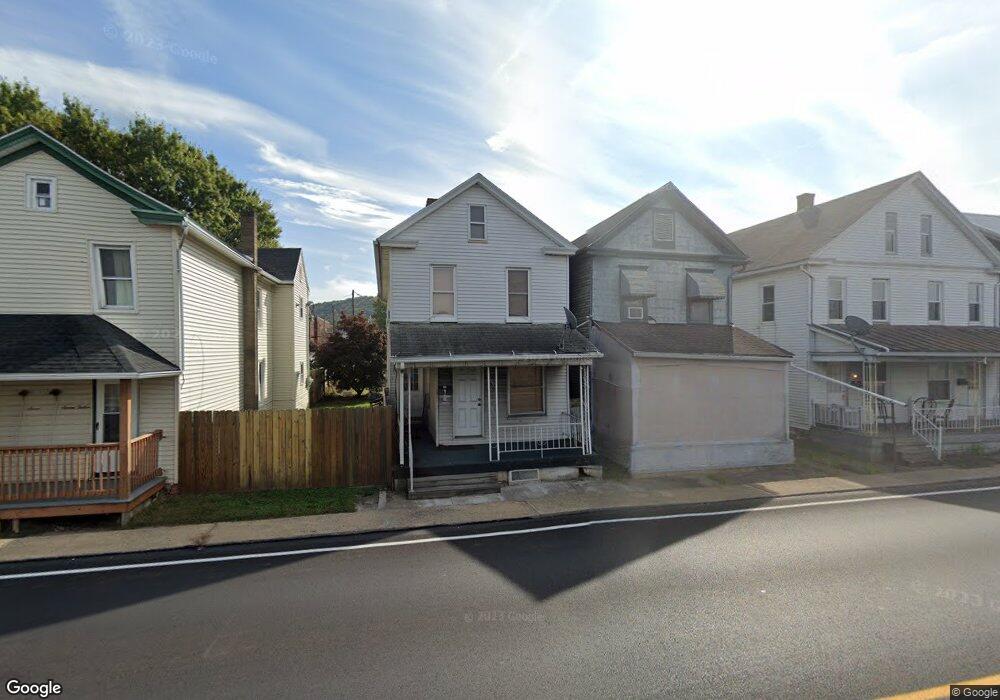
716 S Front St Sunbury, PA 17801
Estimated Value: $68,000 - $135,000
3
Beds
1
Bath
1,906
Sq Ft
$52/Sq Ft
Est. Value
About This Home
This home is located at 716 S Front St, Sunbury, PA 17801 and is currently estimated at $98,175, approximately $51 per square foot. 716 S Front St is a home located in Northumberland County with nearby schools including Shikellamy High School, St Monica School, and Northumberland Christian School.
Ownership History
Date
Name
Owned For
Owner Type
Purchase Details
Closed on
Aug 3, 2023
Sold by
Gange Jennifer
Bought by
Gange Jennifer
Current Estimated Value
Home Financials for this Owner
Home Financials are based on the most recent Mortgage that was taken out on this home.
Original Mortgage
$61,050
Outstanding Balance
$57,789
Interest Rate
6.67%
Mortgage Type
FHA
Estimated Equity
$40,386
Purchase Details
Closed on
Jan 26, 2007
Sold by
Rowe Clayton G and Rowe Sharon K
Bought by
Irwin Jennifer A
Home Financials for this Owner
Home Financials are based on the most recent Mortgage that was taken out on this home.
Original Mortgage
$59,400
Interest Rate
6.15%
Mortgage Type
New Conventional
Purchase Details
Closed on
Oct 19, 2005
Sold by
Secretary Of Hudq
Bought by
Roew Clayton G and Haupt Betty J
Home Financials for this Owner
Home Financials are based on the most recent Mortgage that was taken out on this home.
Original Mortgage
$35,000
Interest Rate
5.85%
Mortgage Type
New Conventional
Create a Home Valuation Report for This Property
The Home Valuation Report is an in-depth analysis detailing your home's value as well as a comparison with similar homes in the area
Home Values in the Area
Average Home Value in this Area
Purchase History
| Date | Buyer | Sale Price | Title Company |
|---|---|---|---|
| Gange Jennifer | -- | Timios | |
| Irwin Jennifer A | $69,900 | None Available | |
| Roew Clayton G | $31,000 | None Available |
Source: Public Records
Mortgage History
| Date | Status | Borrower | Loan Amount |
|---|---|---|---|
| Open | Gange Jennifer | $61,050 | |
| Previous Owner | Irwin Jennifer A | $59,400 | |
| Previous Owner | Roew Clayton G | $35,000 |
Source: Public Records
Tax History Compared to Growth
Tax History
| Year | Tax Paid | Tax Assessment Tax Assessment Total Assessment is a certain percentage of the fair market value that is determined by local assessors to be the total taxable value of land and additions on the property. | Land | Improvement |
|---|---|---|---|---|
| 2025 | $1,203 | $7,350 | $1,240 | $6,110 |
| 2024 | $1,166 | $7,350 | $1,240 | $6,110 |
| 2023 | $1,166 | $7,350 | $1,240 | $6,110 |
| 2022 | $1,159 | $7,350 | $1,240 | $6,110 |
| 2021 | $1,144 | $7,350 | $1,240 | $6,110 |
| 2020 | $1,144 | $7,350 | $1,240 | $6,110 |
| 2019 | $1,113 | $7,350 | $1,240 | $6,110 |
| 2018 | $1,099 | $7,350 | $1,240 | $6,110 |
| 2017 | $1,052 | $7,350 | $1,240 | $6,110 |
| 2016 | -- | $7,350 | $1,240 | $6,110 |
| 2015 | -- | $7,350 | $1,240 | $6,110 |
| 2014 | -- | $7,350 | $1,240 | $6,110 |
Source: Public Records
Map
Nearby Homes
- 234 Spruce St
- 340 Linden St
- 323 Walnut St
- 203 S 4th St
- 134 Chestnut St
- 124 S 4th St
- 152 Market St Unit 154
- 142 Market St
- 310 Arch St
- 346 Arch St Unit 348
- 112 S 10th St
- 150 N Front St
- 53 N 6th St
- 160 N Front St
- 425 Race St
- 141 N 6th St
- 3424 N Old Trail
- 1140 Chestnut St
- 99 Catawissa Ave Unit 101
- 135 N 11th St
- 718 S Front St
- 712 S Front St
- 712 S Front 2nd Floor St
- 712 S Front 1st Floor St
- 720 S Front St Unit 722
- 710 S Front St
- 734 S Front St Unit 736
- 740 S Front St
- 129 South St
- 130 Bainbridge St
- 120 Bainbridge St
- 128 Bainbridge St
- 132 Bainbridge St
- 638 S Front St Unit 640
- 134 Bainbridge St
- 136 Bainbridge St
- 636 S Front St
- 129 Bainbridge St
- 138 Bainbridge St
- 128 South St Unit 130