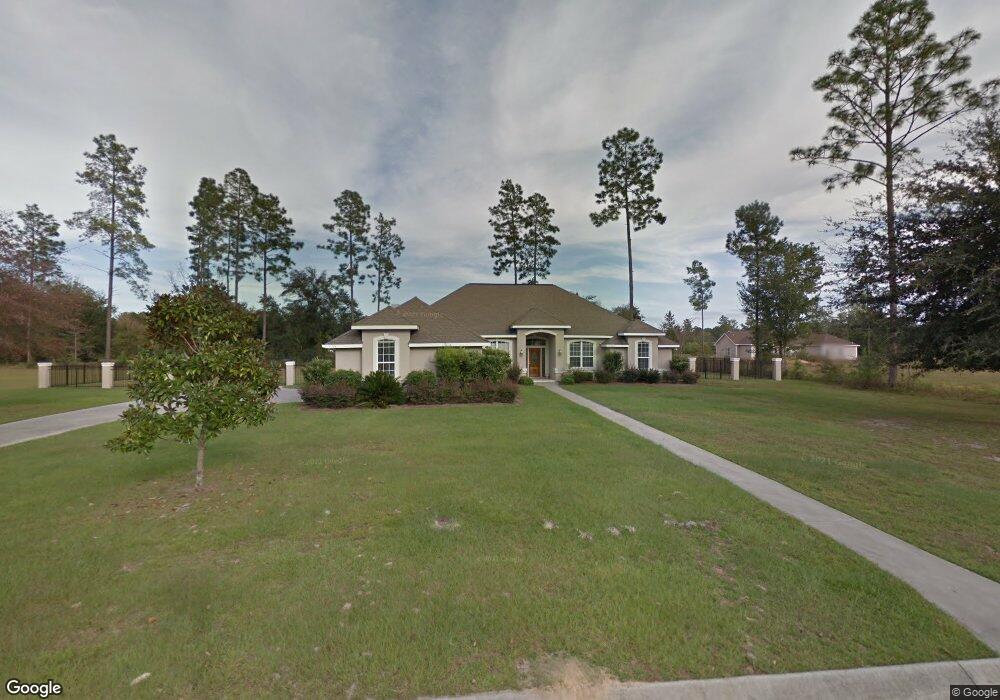
716 Stonewall Jackson Place Waycross, GA 31503
Estimated Value: $398,495 - $487,000
4
Beds
3
Baths
2,548
Sq Ft
$177/Sq Ft
Est. Value
About This Home
This home is located at 716 Stonewall Jackson Place, Waycross, GA 31503 and is currently estimated at $451,874, approximately $177 per square foot. 716 Stonewall Jackson Place is a home located in Ware County with nearby schools including Memorial Drive Elementary School, Waycross Middle School, and Ware County High School.
Ownership History
Date
Name
Owned For
Owner Type
Purchase Details
Closed on
Nov 30, 2016
Sold by
Franklin W
Bought by
Lascelles Terry L and Lascelles Lascelle Faye Lou
Current Estimated Value
Home Financials for this Owner
Home Financials are based on the most recent Mortgage that was taken out on this home.
Original Mortgage
$184,800
Outstanding Balance
$149,315
Interest Rate
3.54%
Mortgage Type
New Conventional
Estimated Equity
$302,559
Purchase Details
Closed on
Feb 21, 2006
Sold by
Kimbro Kenneth E
Bought by
Baugh Franklin W
Home Financials for this Owner
Home Financials are based on the most recent Mortgage that was taken out on this home.
Original Mortgage
$227,200
Interest Rate
6.05%
Mortgage Type
New Conventional
Purchase Details
Closed on
Dec 17, 2002
Sold by
Cayman Builders
Bought by
Kimbro Kenneth
Purchase Details
Closed on
Dec 12, 2002
Sold by
Blount Thomas
Bought by
Cayman Builders
Purchase Details
Closed on
May 24, 2002
Sold by
Blount Thomas E
Bought by
Cayman Builders
Create a Home Valuation Report for This Property
The Home Valuation Report is an in-depth analysis detailing your home's value as well as a comparison with similar homes in the area
Home Values in the Area
Average Home Value in this Area
Purchase History
| Date | Buyer | Sale Price | Title Company |
|---|---|---|---|
| Lascelles Terry L | $217,500 | -- | |
| Baugh Franklin W | $284,000 | -- | |
| Kimbro Kenneth | $280,000 | -- | |
| Cayman Builders | -- | -- | |
| Cayman Builders | $28,000 | -- |
Source: Public Records
Mortgage History
| Date | Status | Borrower | Loan Amount |
|---|---|---|---|
| Open | Lascelles Terry L | $184,800 | |
| Previous Owner | Baugh Franklin W | $227,200 |
Source: Public Records
Tax History Compared to Growth
Tax History
| Year | Tax Paid | Tax Assessment Tax Assessment Total Assessment is a certain percentage of the fair market value that is determined by local assessors to be the total taxable value of land and additions on the property. | Land | Improvement |
|---|---|---|---|---|
| 2024 | $2,228 | $147,734 | $13,800 | $133,934 |
| 2023 | $2,272 | $126,834 | $11,500 | $115,334 |
| 2022 | $2,572 | $126,834 | $11,500 | $115,334 |
| 2021 | $2,744 | $118,848 | $11,500 | $107,348 |
| 2020 | $2,774 | $99,693 | $11,500 | $88,193 |
| 2019 | $2,828 | $92,669 | $11,500 | $81,169 |
| 2018 | $2,855 | $89,476 | $11,500 | $77,976 |
| 2017 | $2,971 | $89,476 | $11,500 | $77,976 |
| 2016 | $2,971 | $91,130 | $11,500 | $79,630 |
| 2015 | $3,098 | $94,144 | $14,000 | $80,144 |
| 2014 | $3,160 | $96,144 | $16,000 | $80,144 |
| 2013 | -- | $91,637 | $16,000 | $75,637 |
Source: Public Records
Map
Nearby Homes
- 630 Saddle Cir
- 851 Carriage Ln
- 606 Stonewall Jackson Place
- 627 Saddle Cir
- 664 Saddle Cir
- 1072 Lawhorne Dr
- 3817 Central Ave
- 4155 Pinecrest Rd
- 1132 Hilltop Rd
- Tract 4 County-Line Rd S
- 4337 White Hall Church Rd
- 4337 Whitehall Church Rd
- 3070 Central Ave
- 3153 Southwood Dr
- 867 Kentland Dr
- 763 Kentland Dr
- 2775 Seminole Trail
- 4408 Brunswick Hwy
- 723 St Bernard Trail
- 1049 Riverdale Dr
- 710 Stonewall Jackson Place
- 800 Stonewall Jackson Place
- 10 Stonewall Jackson Place
- 715 Stonewall Jackson Place
- 616 Saddle Cir
- 624 Saddle Cir
- 801 Stonewall Jackson Place
- Lot 17 Saddle Cir
- Lot 6 Saddle Cir
- 0000 Lots 1 & 2 Saddle Cir
- 0000 Saddle Cir
- 0000 Saddle Cir
- 707 Stonewall Jackson Place
- 704 Stonewall Jackson Place
- 714 Confederate Way
- 701 Stonewall Jackson Place
- 800 Confederate Way
- 708 Confederate Way
- 931 Carriage Ln
- 955 Carriage Ln