Estimated Value: $140,000 - $175,000
2
Beds
2
Baths
1,050
Sq Ft
$147/Sq Ft
Est. Value
About This Home
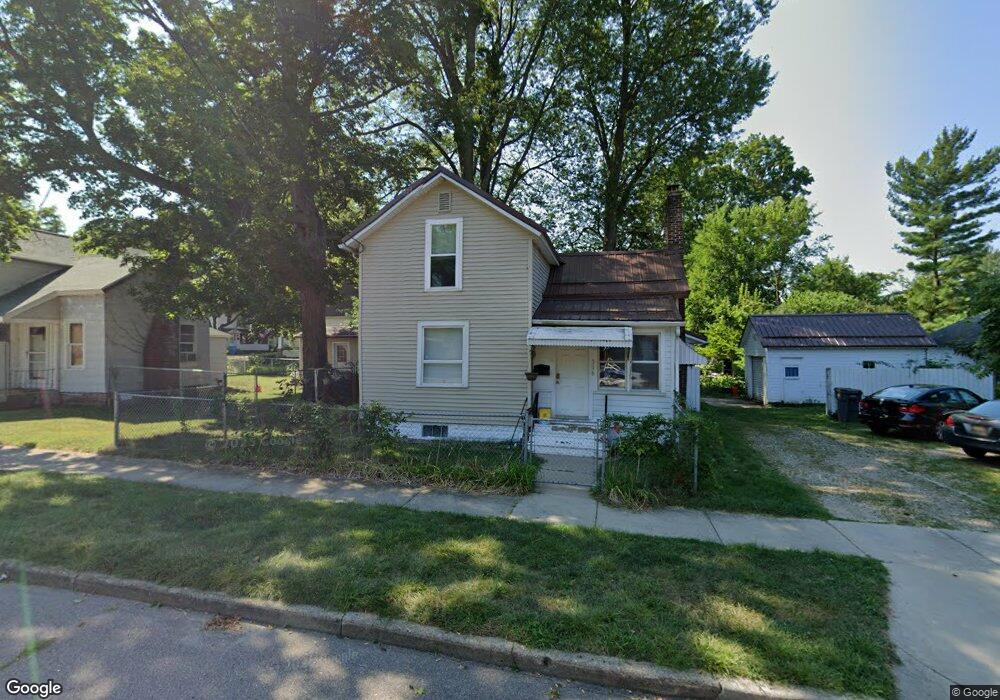
This home is located at 716 Sycamore St, Niles, MI 49120 and is currently estimated at $154,063, approximately $146 per square foot. 716 Sycamore St is a home located in Berrien County with nearby schools including Ballard Elementary School, Oak Manor Sixth Grade Center, and Ring Lardner Middle School.
Ownership History
Date
Name
Owned For
Owner Type
Purchase Details
Closed on
Mar 31, 2011
Sold by
Heron Joseph and Heron Courtney
Bought by
Ness Jonathan C
Current Estimated Value
Purchase Details
Closed on
May 15, 2008
Sold by
Trueblood Timothy A and Trueblood Dawn M
Bought by
U S Bank Na
Purchase Details
Closed on
Nov 14, 2005
Sold by
Wiars Phillys L
Bought by
Trueblood Timothy A and Trueblood Dawn M
Home Financials for this Owner
Home Financials are based on the most recent Mortgage that was taken out on this home.
Original Mortgage
$52,000
Interest Rate
6.36%
Mortgage Type
Fannie Mae Freddie Mac
Create a Home Valuation Report for This Property
The Home Valuation Report is an in-depth analysis detailing your home's value as well as a comparison with similar homes in the area
Home Values in the Area
Average Home Value in this Area
Purchase History
| Date | Buyer | Sale Price | Title Company |
|---|---|---|---|
| Ness Jonathan C | $20,000 | Cti | |
| U S Bank Na | $54,076 | None Available | |
| Trueblood Timothy A | $65,000 | Title Works Inc |
Source: Public Records
Mortgage History
| Date | Status | Borrower | Loan Amount |
|---|---|---|---|
| Previous Owner | Trueblood Timothy A | $52,000 |
Source: Public Records
Tax History Compared to Growth
Tax History
| Year | Tax Paid | Tax Assessment Tax Assessment Total Assessment is a certain percentage of the fair market value that is determined by local assessors to be the total taxable value of land and additions on the property. | Land | Improvement |
|---|---|---|---|---|
| 2025 | $952 | $74,000 | $0 | $0 |
| 2024 | $736 | $66,100 | $0 | $0 |
| 2023 | $705 | $46,600 | $0 | $0 |
| 2022 | $672 | $36,400 | $0 | $0 |
| 2021 | $832 | $33,700 | $3,200 | $30,500 |
| 2020 | $823 | $31,500 | $0 | $0 |
| 2019 | $813 | $21,700 | $2,100 | $19,600 |
| 2018 | $852 | $21,700 | $0 | $0 |
| 2017 | $930 | $26,300 | $0 | $0 |
| 2016 | $910 | $24,400 | $0 | $0 |
| 2015 | $907 | $24,500 | $0 | $0 |
| 2014 | $705 | $23,600 | $0 | $0 |
Source: Public Records
Map
Nearby Homes