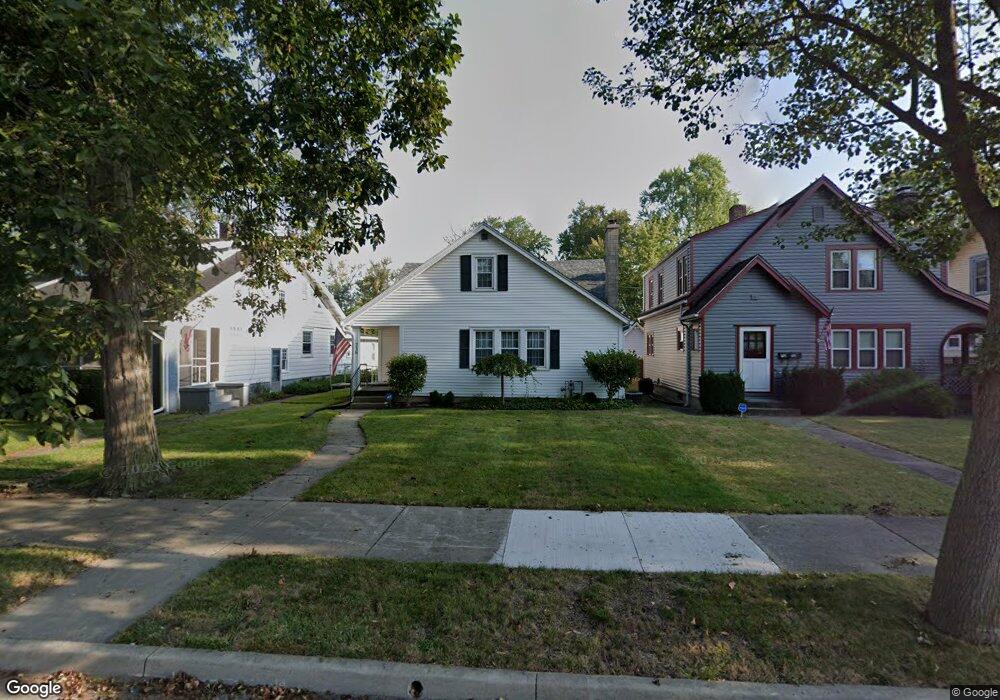
716 W Main St Richmond, IN 47374
Estimated Value: $147,149 - $160,000
5
Beds
3
Baths
2,832
Sq Ft
$54/Sq Ft
Est. Value
About This Home
This home is located at 716 W Main St, Richmond, IN 47374 and is currently estimated at $151,787, approximately $53 per square foot. 716 W Main St is a home located in Wayne County with nearby schools including Westview Elementary School, Dennis Middle School, and Richmond High School.
Ownership History
Date
Name
Owned For
Owner Type
Purchase Details
Closed on
Jun 1, 2021
Sold by
Markley Stephen D and Ricks Melissa A
Bought by
Markley Craig P and Markley Lisa L
Current Estimated Value
Home Financials for this Owner
Home Financials are based on the most recent Mortgage that was taken out on this home.
Original Mortgage
$48,750
Outstanding Balance
$44,041
Interest Rate
2.9%
Mortgage Type
New Conventional
Estimated Equity
$107,746
Purchase Details
Closed on
Aug 10, 2016
Sold by
Markley Annabel N
Bought by
Burch Jennifer J and Markley Annabel N
Create a Home Valuation Report for This Property
The Home Valuation Report is an in-depth analysis detailing your home's value as well as a comparison with similar homes in the area
Home Values in the Area
Average Home Value in this Area
Purchase History
| Date | Buyer | Sale Price | Title Company |
|---|---|---|---|
| Markley Craig P | -- | None Available | |
| Burch Jennifer J | -- | Attorney |
Source: Public Records
Mortgage History
| Date | Status | Borrower | Loan Amount |
|---|---|---|---|
| Open | Markley Craig P | $48,750 |
Source: Public Records
Tax History Compared to Growth
Tax History
| Year | Tax Paid | Tax Assessment Tax Assessment Total Assessment is a certain percentage of the fair market value that is determined by local assessors to be the total taxable value of land and additions on the property. | Land | Improvement |
|---|---|---|---|---|
| 2024 | $1,048 | $104,800 | $11,800 | $93,000 |
| 2023 | $945 | $91,900 | $10,400 | $81,500 |
| 2022 | $954 | $92,800 | $10,400 | $82,400 |
| 2021 | $885 | $85,900 | $10,400 | $75,500 |
| 2020 | $161 | $88,500 | $10,400 | $78,100 |
| 2019 | $159 | $86,500 | $10,400 | $76,100 |
| 2018 | $156 | $86,500 | $10,400 | $76,100 |
| 2017 | $139 | $80,600 | $10,400 | $70,200 |
| 2016 | $137 | $83,900 | $10,400 | $73,500 |
| 2014 | $123 | $79,600 | $10,400 | $69,200 |
| 2013 | $123 | $74,700 | $10,400 | $64,300 |
Source: Public Records
Map
Nearby Homes