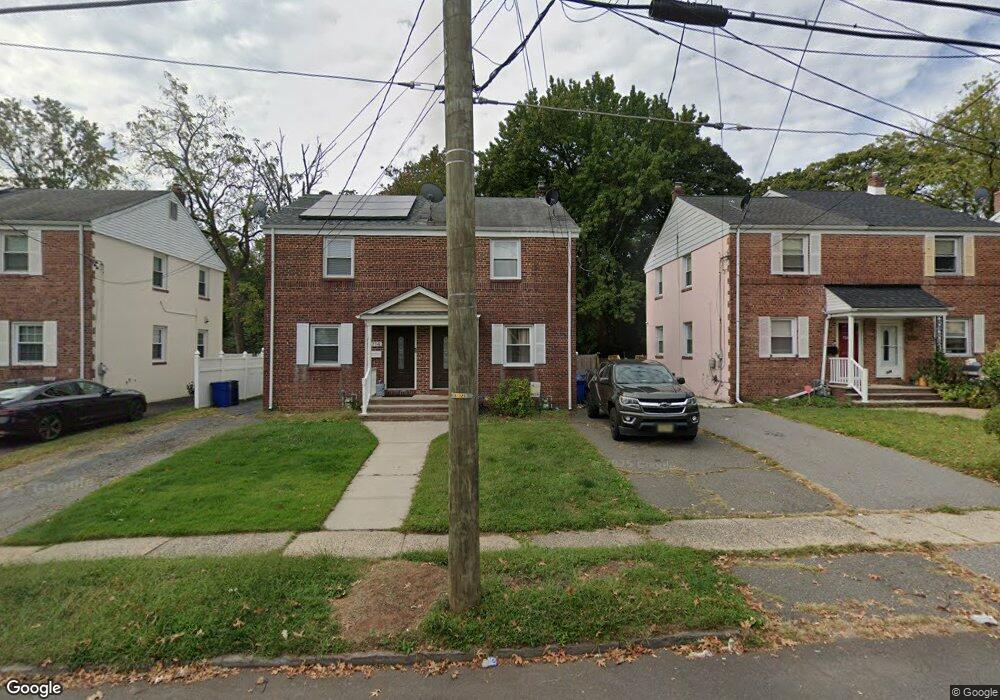
716 W Scott Ave Rahway, NJ 07065
Estimated Value: $365,855 - $416,000
--
Bed
--
Bath
864
Sq Ft
$444/Sq Ft
Est. Value
About This Home
This home is located at 716 W Scott Ave, Rahway, NJ 07065 and is currently estimated at $383,714, approximately $444 per square foot. 716 W Scott Ave is a home located in Union County with nearby schools including Rahway High School and St John The Apostle School.
Ownership History
Date
Name
Owned For
Owner Type
Purchase Details
Closed on
Jul 20, 2005
Sold by
Malanga Daniel
Bought by
Malanga Matthew
Current Estimated Value
Home Financials for this Owner
Home Financials are based on the most recent Mortgage that was taken out on this home.
Original Mortgage
$100,000
Outstanding Balance
$52,100
Interest Rate
5.63%
Mortgage Type
Purchase Money Mortgage
Estimated Equity
$331,614
Purchase Details
Closed on
Jul 25, 2000
Sold by
Jatu Bholanauth and Jatu Yognattee D
Bought by
Chapman Yvette I
Home Financials for this Owner
Home Financials are based on the most recent Mortgage that was taken out on this home.
Original Mortgage
$88,954
Interest Rate
8.06%
Mortgage Type
FHA
Purchase Details
Closed on
Apr 24, 1996
Sold by
Schenkel Sylvia and Schenkel Allan
Bought by
Jatu Bholanauth and Jatu Yognattee D
Create a Home Valuation Report for This Property
The Home Valuation Report is an in-depth analysis detailing your home's value as well as a comparison with similar homes in the area
Home Values in the Area
Average Home Value in this Area
Purchase History
| Date | Buyer | Sale Price | Title Company |
|---|---|---|---|
| Malanga Matthew | $125,000 | -- | |
| Chapman Yvette I | $89,000 | Lawyers Title Insurance Corp | |
| Jatu Bholanauth | $65,000 | -- |
Source: Public Records
Mortgage History
| Date | Status | Borrower | Loan Amount |
|---|---|---|---|
| Open | Malanga Matthew | $100,000 | |
| Previous Owner | Chapman Yvette I | $88,954 |
Source: Public Records
Tax History Compared to Growth
Tax History
| Year | Tax Paid | Tax Assessment Tax Assessment Total Assessment is a certain percentage of the fair market value that is determined by local assessors to be the total taxable value of land and additions on the property. | Land | Improvement |
|---|---|---|---|---|
| 2025 | $6,620 | $89,400 | $51,400 | $38,000 |
| 2024 | $6,412 | $89,400 | $51,400 | $38,000 |
| 2023 | $6,412 | $89,400 | $51,400 | $38,000 |
| 2022 | $6,278 | $89,400 | $51,400 | $38,000 |
| 2021 | $6,214 | $89,400 | $51,400 | $38,000 |
| 2020 | $6,191 | $89,400 | $51,400 | $38,000 |
| 2019 | $6,112 | $89,400 | $51,400 | $38,000 |
| 2018 | $5,984 | $89,400 | $51,400 | $38,000 |
| 2017 | $5,836 | $89,400 | $51,400 | $38,000 |
| 2016 | $5,712 | $89,400 | $51,400 | $38,000 |
| 2015 | $5,647 | $89,400 | $51,400 | $38,000 |
| 2014 | $5,546 | $89,400 | $51,400 | $38,000 |
Source: Public Records
Map
Nearby Homes
- 826 W Scott Ave
- 2184 Evans St Unit 1
- 910 Apgar Terrace
- 554 Harrison St
- 2000 Whittier St
- 2315 Desisto Dr
- 1751 Oliver St Unit 59
- 1751 Oliver St Unit 1759
- 653 Cora Place
- 374 Raleigh Rd
- 65 Colonial Dr
- 272 Egolf Dr
- 244 W Scott Ave Unit 2
- 392 Lower Alden Dr
- 403 Seminary Ave
- 1017 Stuart Place
- 380 Seminary Ave
- 2012 Price St
- 52 Skylark Place
- 1489 Jefferson Ave
- 714 W Scott Ave
- 724 W Scott Ave
- 726 W Scott Ave
- 706 W Scott Ave
- 732 W Scott Ave
- 704 W Scott Ave
- 734 W Scott Ave
- 736 W Scott Ave
- 696 W Scott Ave
- 744 W Scott Ave
- 719 River Rd
- 711 River Rd
- 746 W Scott Ave
- 688 W Scott Ave
- 735 River Rd
- 717 W Scott Ave
- 697 River Rd
- 727 W Scott Ave
- 729 W Scott Ave
- 754 W Scott Ave