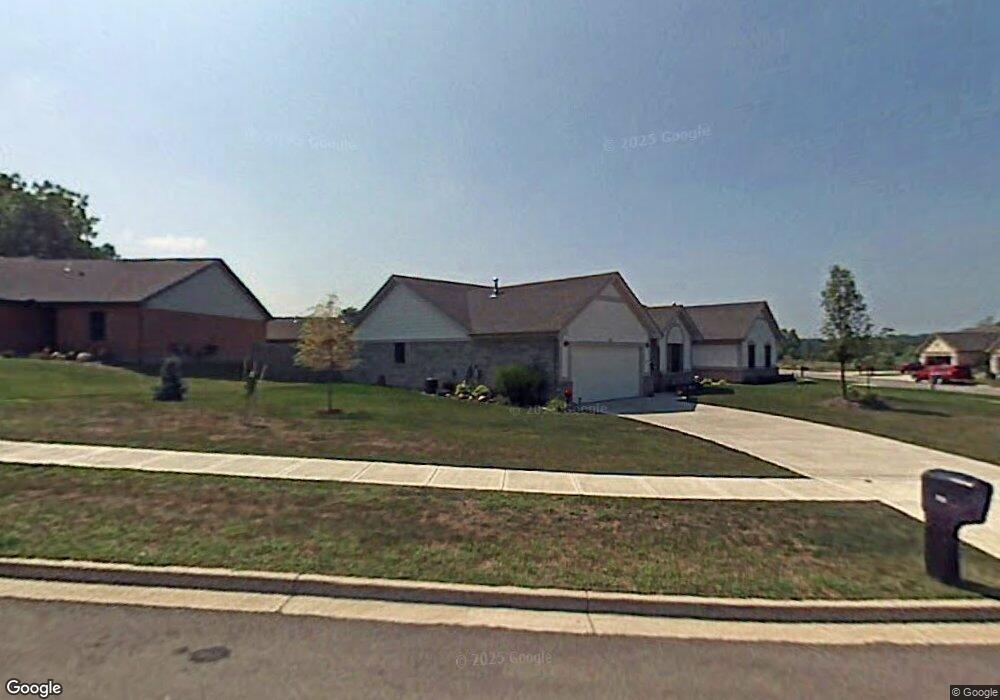
716 Waldsmith Way Vandalia, OH 45377
Estimated Value: $242,000 - $271,000
3
Beds
2
Baths
1,394
Sq Ft
$181/Sq Ft
Est. Value
About This Home
This home is located at 716 Waldsmith Way, Vandalia, OH 45377 and is currently estimated at $252,877, approximately $181 per square foot. 716 Waldsmith Way is a home located in Montgomery County with nearby schools including Demmitt Elementary School, Smith Middle School, and Butler High School.
Ownership History
Date
Name
Owned For
Owner Type
Purchase Details
Closed on
May 3, 2021
Sold by
Hefclfinger Gary R and Hefelfinger Phyffis J
Bought by
Helefinger Gray R and Hefelfinger Phyllis J
Current Estimated Value
Purchase Details
Closed on
Oct 27, 2020
Sold by
Mattingly Nancy L
Bought by
Hefelfinger Gary R and Hefelfinger Phyllis J
Purchase Details
Closed on
Mar 31, 2005
Sold by
Newmark Homes Inc
Bought by
Mattingly Nancy L
Home Financials for this Owner
Home Financials are based on the most recent Mortgage that was taken out on this home.
Original Mortgage
$30,000
Interest Rate
5.64%
Mortgage Type
Fannie Mae Freddie Mac
Create a Home Valuation Report for This Property
The Home Valuation Report is an in-depth analysis detailing your home's value as well as a comparison with similar homes in the area
Home Values in the Area
Average Home Value in this Area
Purchase History
| Date | Buyer | Sale Price | Title Company |
|---|---|---|---|
| Helefinger Gray R | -- | Fidelity Lawyers Ttl Agcy Ll | |
| Hefelfinger Gary R | $175,000 | Fidelity Lawyers Ttl Agcy Ll | |
| Mattingly Nancy L | $158,300 | None Available |
Source: Public Records
Mortgage History
| Date | Status | Borrower | Loan Amount |
|---|---|---|---|
| Previous Owner | Mattingly Nancy L | $30,000 |
Source: Public Records
Tax History Compared to Growth
Tax History
| Year | Tax Paid | Tax Assessment Tax Assessment Total Assessment is a certain percentage of the fair market value that is determined by local assessors to be the total taxable value of land and additions on the property. | Land | Improvement |
|---|---|---|---|---|
| 2024 | $3,351 | $64,190 | $14,360 | $49,830 |
| 2023 | $3,351 | $64,190 | $14,360 | $49,830 |
| 2022 | $3,071 | $47,550 | $10,640 | $36,910 |
| 2021 | $3,073 | $47,550 | $10,640 | $36,910 |
| 2020 | $2,505 | $47,550 | $10,640 | $36,910 |
| 2019 | $2,299 | $41,370 | $10,110 | $31,260 |
| 2018 | $2,303 | $41,370 | $10,110 | $31,260 |
| 2017 | $2,264 | $41,370 | $10,110 | $31,260 |
| 2016 | $2,539 | $44,700 | $10,640 | $34,060 |
| 2015 | $2,507 | $44,700 | $10,640 | $34,060 |
| 2014 | $2,507 | $44,700 | $10,640 | $34,060 |
| 2012 | -- | $46,230 | $13,300 | $32,930 |
Source: Public Records
Map
Nearby Homes
- 770 Deer Creek Dr
- 592 O'Hara Ct
- 469 Farrell Rd
- 416 Bent Twig Dr
- 461 Poplar Grove Dr
- 912 Kenbrook Dr
- 775 Cassel Creek Dr
- 521 Rader Dr
- 917 Howard Ln
- 651 Cassel Hills Ct Unit 15
- 246 Crest Hill Ave
- 436 Rader Dr
- 844 Kenneth Ave Unit 846
- 925 Robinette Ave
- 827 Foxfire Trail
- 3749 Whisper Creek Dr
- 663 Deerhurst Dr
- 675 Deerhurst Dr
- 668 Deerhurst Dr
- 1063 Royalton Dr
- 718 Waldsmith Way
- 708 Waldsmith Way
- 724 Waldsmith Way
- 704 Waldsmith Way
- 732 Waldsmith Way
- 719 Hunters Chase Dr
- 705 Hunters Chase Dr
- 719 Waldsmith Way
- 721 Waldsmith Way
- 717 Waldsmith Way
- 738 Waldsmith Way
- 723 Waldsmith Way
- 733 Hunters Chase Dr
- 715 Waldsmith Way
- 746 Waldsmith Way
- 737 Waldsmith Way
- 701 Waldsmith Way
- 693 Waldsmith Way
- 713 Waldsmith Way
- 745 Waldsmith Way