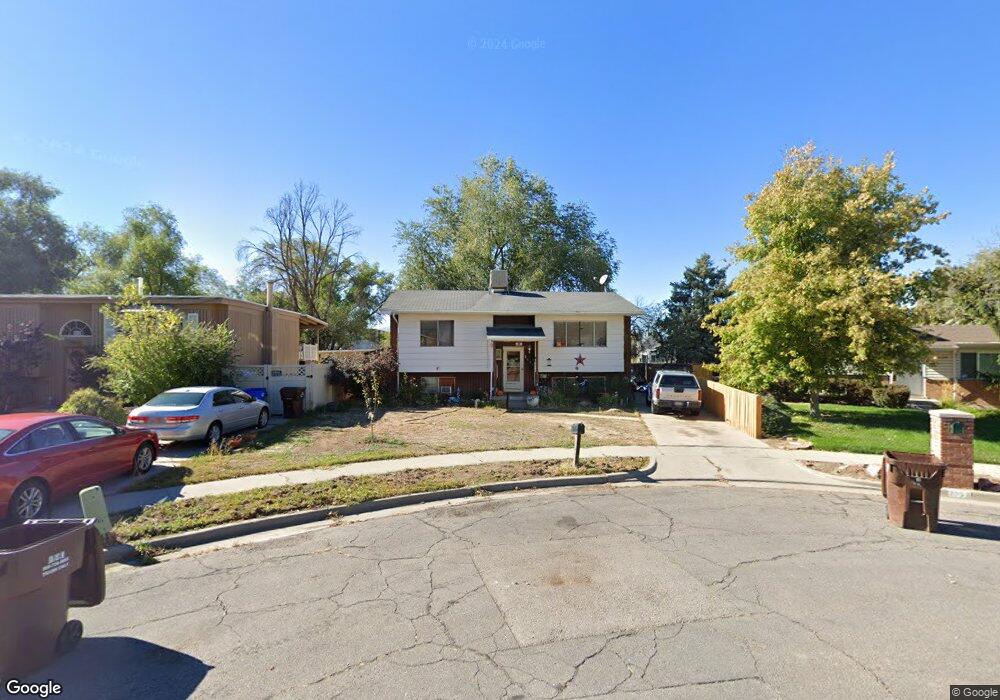
7160 S 350 E Midvale, UT 84047
Estimated Value: $463,840 - $514,000
3
Beds
2
Baths
1,828
Sq Ft
$263/Sq Ft
Est. Value
About This Home
This home is located at 7160 S 350 E, Midvale, UT 84047 and is currently estimated at $481,210, approximately $263 per square foot. 7160 S 350 E is a home located in Salt Lake County with nearby schools including East Midvale Elementary School, Hillcrest High School, and Midvale Middle School.
Ownership History
Date
Name
Owned For
Owner Type
Purchase Details
Closed on
Dec 18, 2008
Sold by
Kramer Gerald and Kramer Gelasia
Bought by
Flores Paul and Kramer Gelasia
Current Estimated Value
Home Financials for this Owner
Home Financials are based on the most recent Mortgage that was taken out on this home.
Original Mortgage
$214,018
Outstanding Balance
$141,619
Interest Rate
6.16%
Mortgage Type
FHA
Estimated Equity
$339,591
Purchase Details
Closed on
Nov 6, 2007
Sold by
Woodall Cynthia Ann
Bought by
Kramer Gerald and Kramer Gelasia
Create a Home Valuation Report for This Property
The Home Valuation Report is an in-depth analysis detailing your home's value as well as a comparison with similar homes in the area
Home Values in the Area
Average Home Value in this Area
Purchase History
| Date | Buyer | Sale Price | Title Company |
|---|---|---|---|
| Flores Paul | -- | Priority Title Ins Agcy | |
| Kramer Gerald | -- | Meridian Title |
Source: Public Records
Mortgage History
| Date | Status | Borrower | Loan Amount |
|---|---|---|---|
| Open | Flores Paul | $214,018 |
Source: Public Records
Tax History
| Year | Tax Paid | Tax Assessment Tax Assessment Total Assessment is a certain percentage of the fair market value that is determined by local assessors to be the total taxable value of land and additions on the property. | Land | Improvement |
|---|---|---|---|---|
| 2025 | $2,464 | $422,900 | $156,500 | $266,400 |
| 2024 | $2,464 | $404,600 | $147,700 | $256,900 |
| 2023 | $2,349 | $382,100 | $140,400 | $241,700 |
| 2022 | $2,450 | $389,400 | $117,000 | $272,400 |
| 2021 | $2,175 | $295,600 | $108,000 | $187,600 |
| 2020 | $2,056 | $264,400 | $88,700 | $175,700 |
| 2019 | $1,973 | $247,200 | $83,700 | $163,500 |
| 2016 | $1,644 | $194,100 | $83,700 | $110,400 |
Source: Public Records
Map
Nearby Homes
- 7218 S Viansa Ct
- 7045 S 300 E
- 7187 S 420 E
- 7097 S 230 E
- 221 E Fort Union Blvd
- 7309 S Union Village Cir
- 7240 S 525 E Unit A
- 7240 S 525 E Unit B
- 195 E 7060 S
- 7230 S 525 E Unit A
- 7230 S 525 E Unit B
- 7230 S 525 E
- 529 E 7215 S Unit 9
- 7214 S 160 E Unit 1
- 7222 S 160 E Unit 3
- 7299 S 525 E
- 7255 S 525 E
- 7377 S Ramanee Dr
- 106 E 7320 S
- 7083 Village Place
Your Personal Tour Guide
Ask me questions while you tour the home.