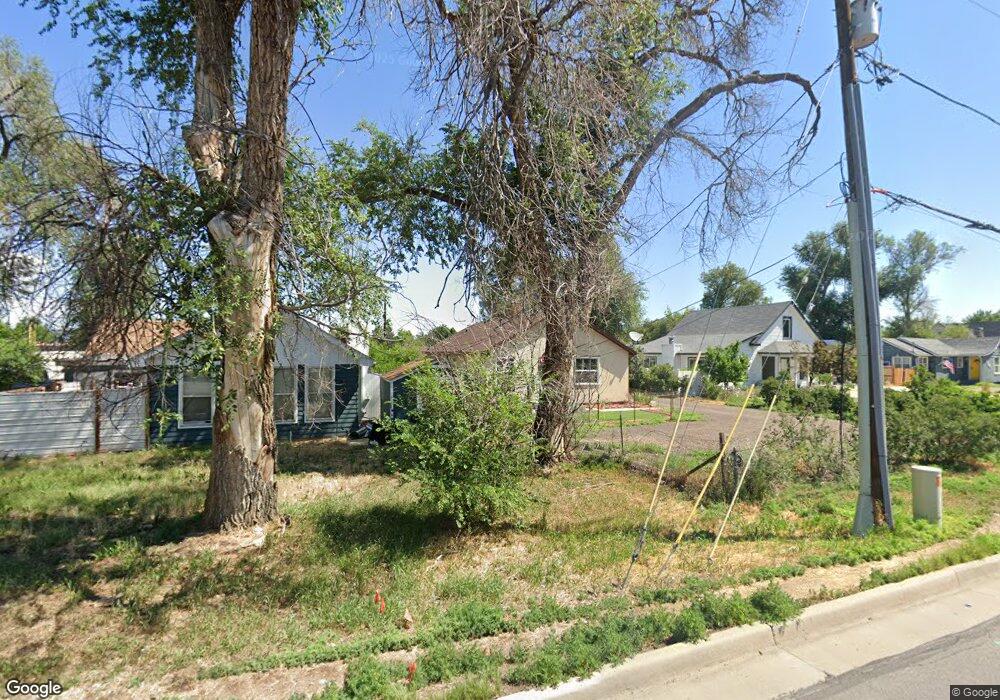
7161 W 52nd Ave Arvada, CO 80002
Estimated Value: $480,000 - $568,000
3
Beds
2
Baths
1,560
Sq Ft
$337/Sq Ft
Est. Value
About This Home
This home is located at 7161 W 52nd Ave, Arvada, CO 80002 and is currently estimated at $525,372, approximately $336 per square foot. 7161 W 52nd Ave is a home located in Jefferson County with nearby schools including Secrest Elementary School, North Arvada Middle School, and Arvada High School.
Ownership History
Date
Name
Owned For
Owner Type
Purchase Details
Closed on
Jan 28, 2013
Sold by
Siebert Claude C
Bought by
Siebert Claude C and Siebert Linda K
Current Estimated Value
Purchase Details
Closed on
Oct 10, 2012
Sold by
Pierson Tarrel L
Bought by
Siebert Claude C
Home Financials for this Owner
Home Financials are based on the most recent Mortgage that was taken out on this home.
Original Mortgage
$25,000
Interest Rate
4.5%
Mortgage Type
Purchase Money Mortgage
Purchase Details
Closed on
Feb 13, 1998
Sold by
Rms Investment Corp
Bought by
Besser Brock Andrew
Home Financials for this Owner
Home Financials are based on the most recent Mortgage that was taken out on this home.
Original Mortgage
$137,750
Interest Rate
7.02%
Purchase Details
Closed on
Oct 10, 1997
Sold by
Devries Rodney R
Bought by
Rms Investment
Create a Home Valuation Report for This Property
The Home Valuation Report is an in-depth analysis detailing your home's value as well as a comparison with similar homes in the area
Home Values in the Area
Average Home Value in this Area
Purchase History
| Date | Buyer | Sale Price | Title Company |
|---|---|---|---|
| Siebert Claude C | -- | None Available | |
| Siebert Claude C | $30,000 | None Available | |
| Besser Brock Andrew | $145,000 | Land Title | |
| Rms Investment | $100,000 | Land Title |
Source: Public Records
Mortgage History
| Date | Status | Borrower | Loan Amount |
|---|---|---|---|
| Closed | Siebert Claude C | $25,000 | |
| Previous Owner | Besser Brock Andrew | $137,750 |
Source: Public Records
Tax History Compared to Growth
Tax History
| Year | Tax Paid | Tax Assessment Tax Assessment Total Assessment is a certain percentage of the fair market value that is determined by local assessors to be the total taxable value of land and additions on the property. | Land | Improvement |
|---|---|---|---|---|
| 2024 | $3,637 | $36,504 | $11,867 | $24,637 |
| 2023 | $3,637 | $36,504 | $11,867 | $24,637 |
| 2022 | $2,984 | $29,762 | $8,748 | $21,014 |
| 2021 | $3,029 | $30,619 | $9,000 | $21,619 |
| 2020 | $2,777 | $28,115 | $7,749 | $20,366 |
| 2019 | $2,741 | $28,115 | $7,749 | $20,366 |
| 2018 | $2,493 | $24,846 | $6,163 | $18,683 |
| 2017 | $2,285 | $24,846 | $6,163 | $18,683 |
| 2016 | $2,001 | $20,471 | $7,146 | $13,325 |
| 2015 | $1,547 | $20,471 | $7,146 | $13,325 |
| 2014 | $1,547 | $14,870 | $5,262 | $9,608 |
Source: Public Records
Map
Nearby Homes
- 6933 W 52nd Place
- 6801 W 52nd Ave
- 5465 Reed Ct
- 5465 Saulsbury Ct
- 5495 Saulsbury Ct
- 6700 W 55th Ave
- 6890 W 55th Place
- 5525 Pierce Ct
- 5513 Newland Way
- 6855 Reno Dr
- 5320 Allison St Unit 106
- 7861 W 51st Ave Unit C
- 7861 W 51st Ave
- 6247 W 53rd Ave
- 5366 Allison St Unit C
- 8028 W 52nd Ln Unit B
- 4755 Reed St
- 5465 Zephyr St Unit 201
- 5223 Allison Way Unit D
- 6920 W 48th Ave Unit 6920