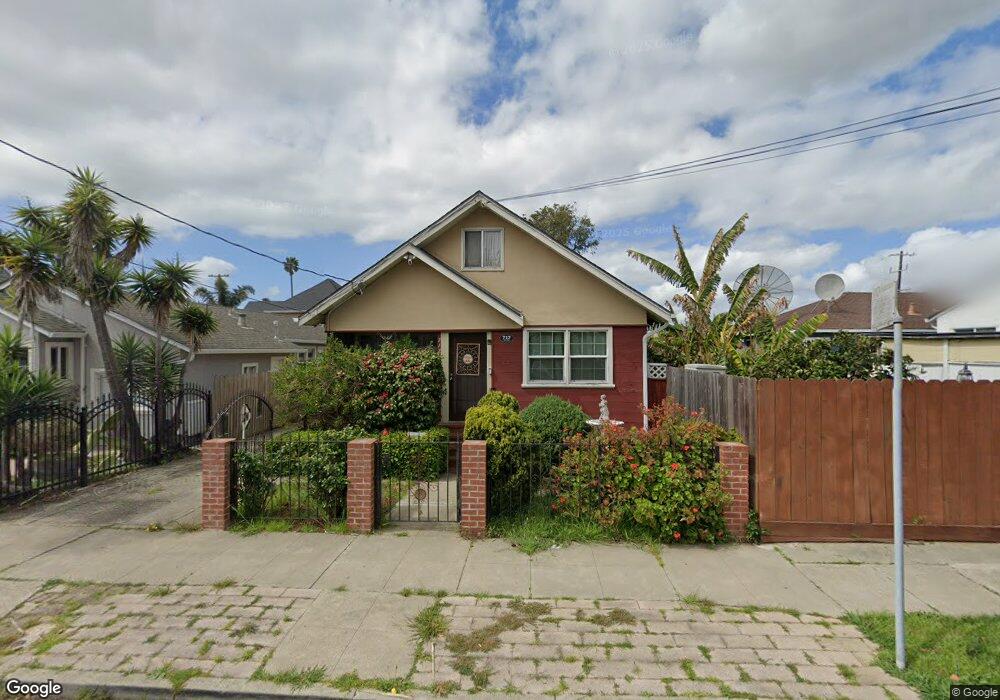
717 26th St Richmond, CA 94804
North & East NeighborhoodEstimated Value: $558,937 - $605,000
About This Home
This home is located at 717 26th St, Richmond, CA 94804 and is currently estimated at $583,234, approximately $487 per square foot. 717 26th St is a home located in Contra Costa County with nearby schools including Michelle Obama School, Lovonya DeJean Middle School, and John F. Kennedy High School.
Ownership History
We collect this data history from publicly available records. To have your information removed, we recommend requesting removal directly through your county’s website.
Purchase Details
Purchase Details
Purchase Details
Home Values in the Area
Average Home Value in this Area
Purchase History
We collect this data history from publicly available records. To have your information removed, we recommend requesting removal directly through your county’s website.
| Date | Buyer | Sale Price | Title Company |
|---|---|---|---|
| -- | None Available | ||
| -- | None Available | ||
| -- | -- |
Tax History
We collect this data history from publicly available records. To have your information removed, we recommend requesting removal directly through your county’s website.
| Year | Tax Paid | Tax Assessment Tax Assessment Total Assessment is a certain percentage of the fair market value that is determined by local assessors to be the total taxable value of land and additions on the property. | Land | Improvement |
|---|---|---|---|---|
| 2025 | $4,760 | $235,741 | $126,609 | $109,132 |
| 2024 | $4,620 | $231,120 | $124,127 | $106,993 |
| 2023 | $4,620 | $226,590 | $121,694 | $104,896 |
| 2022 | $4,511 | $222,148 | $119,308 | $102,840 |
| 2021 | $4,436 | $217,793 | $116,969 | $100,824 |
| 2019 | $4,158 | $211,335 | $113,500 | $97,835 |
| 2018 | $4,006 | $207,192 | $111,275 | $95,917 |
| 2017 | $3,901 | $203,131 | $109,094 | $94,037 |
| 2016 | $3,826 | $199,149 | $106,955 | $92,194 |
| 2015 | $3,786 | $196,159 | $105,349 | $90,810 |
| 2014 | $3,752 | $192,318 | $103,286 | $89,032 |
Map
- 2807 Downer Ave
- 2417 Esmond Ave
- 2880 Gaynor Ave
- 743 30th St
- 670 30th St
- 649 23rd St
- 645 31st St
- 821 31st St
- 2339 Mcbryde Ave
- 3031 Barrett Ave
- 2387 Humphrey Ave
- 1929 Lincoln Ave
- 3200 Mcbryde Ave
- 2726 Rheem Ave
- 3421 Roosevelt Ave
- 2133 Dunn Ave
- 2620 Maricopa Ave
- 3519 Roosevelt Ave
- 1827 Barrett Ave
- 1745 Wood Place
- 2560 Downer Ave
- 2558 Downer Ave
- 2564 Downer Ave
- 2552 Downer Ave
- 2576 Downer Ave
- 0 Downer Ave
- 2546 Downer Ave
- 2580 Downer Ave
- 2565 Clinton Ave
- 2559 Clinton Ave
- 746 26th St
- 2553 Clinton Ave
- 709 26th St
- 2540 Downer Ave
- 2547 Clinton Ave
- 743 26th St
- 2536 Downer Ave
- 748 26th St
- 2543 Clinton Ave
- 2615 Downer Ave
Ask me questions while you tour the home.