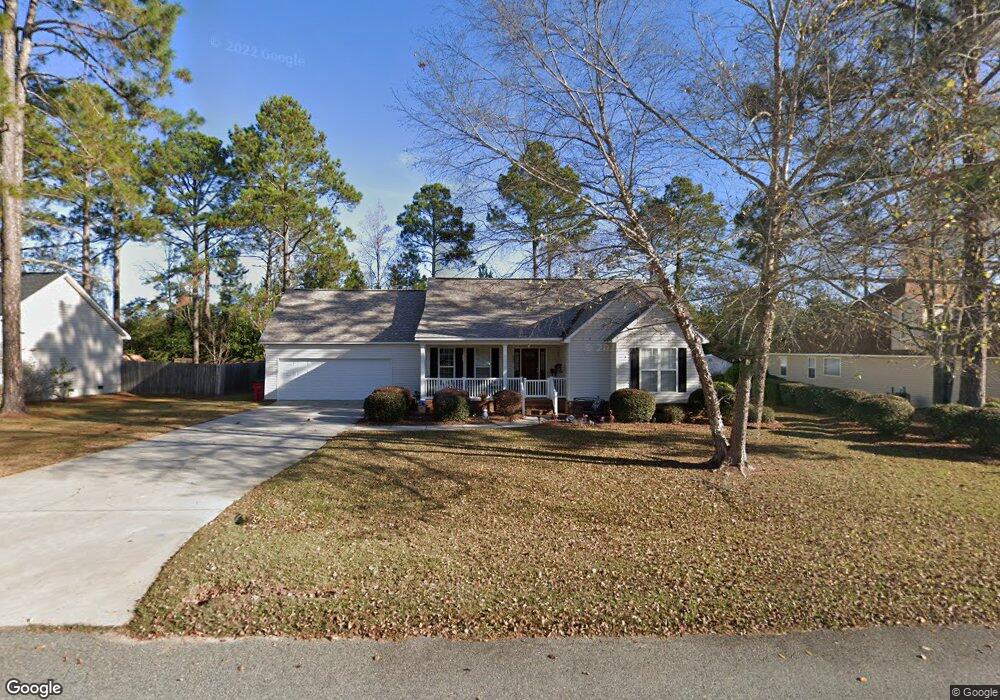
717 50th St Tifton, GA 31794
Estimated Value: $304,490 - $355,000
4
Beds
2
Baths
2,593
Sq Ft
$125/Sq Ft
Est. Value
About This Home
This home is located at 717 50th St, Tifton, GA 31794 and is currently estimated at $323,873, approximately $124 per square foot. 717 50th St is a home located in Tift County with nearby schools including Northside Primary School, Charles Spencer Elementary School, and J.T. Reddick School.
Ownership History
Date
Name
Owned For
Owner Type
Purchase Details
Closed on
Sep 19, 2014
Sold by
Campbell Street Cherrell
Bought by
Yost Mary A
Current Estimated Value
Home Financials for this Owner
Home Financials are based on the most recent Mortgage that was taken out on this home.
Original Mortgage
$187,956
Outstanding Balance
$143,946
Interest Rate
4.15%
Mortgage Type
VA
Estimated Equity
$179,927
Purchase Details
Closed on
Aug 17, 2007
Sold by
Carter Paul D
Bought by
Campbell Street Cherrell
Home Financials for this Owner
Home Financials are based on the most recent Mortgage that was taken out on this home.
Original Mortgage
$184,000
Interest Rate
6.7%
Mortgage Type
New Conventional
Purchase Details
Closed on
Nov 21, 2003
Sold by
Thrash Construction Co I
Bought by
Carter Paul Douglas and Rose Lockhart
Purchase Details
Closed on
May 15, 2000
Sold by
Sunbelt Plantations Inc
Bought by
Thrash Construction Co I
Create a Home Valuation Report for This Property
The Home Valuation Report is an in-depth analysis detailing your home's value as well as a comparison with similar homes in the area
Home Values in the Area
Average Home Value in this Area
Purchase History
| Date | Buyer | Sale Price | Title Company |
|---|---|---|---|
| Yost Mary A | $184,000 | -- | |
| Campbell Street Cherrell | $184,000 | -- | |
| Carter Paul Douglas | $170,000 | -- | |
| Thrash Construction Co I | $150,000 | -- |
Source: Public Records
Mortgage History
| Date | Status | Borrower | Loan Amount |
|---|---|---|---|
| Open | Yost Mary A | $187,956 | |
| Previous Owner | Campbell Street Cherrell | $184,000 |
Source: Public Records
Tax History Compared to Growth
Tax History
| Year | Tax Paid | Tax Assessment Tax Assessment Total Assessment is a certain percentage of the fair market value that is determined by local assessors to be the total taxable value of land and additions on the property. | Land | Improvement |
|---|---|---|---|---|
| 2024 | $3,073 | $117,809 | $10,000 | $107,809 |
| 2023 | $3,270 | $77,312 | $8,000 | $69,312 |
| 2022 | $2,760 | $77,312 | $8,000 | $69,312 |
| 2021 | $2,778 | $77,312 | $8,000 | $69,312 |
| 2020 | $2,348 | $64,487 | $8,000 | $56,487 |
| 2019 | $2,349 | $64,487 | $8,000 | $56,487 |
| 2018 | $2,350 | $64,487 | $8,000 | $56,487 |
| 2017 | $2,412 | $64,487 | $8,000 | $56,487 |
| 2016 | $2,416 | $64,487 | $8,000 | $56,487 |
| 2015 | $2,941 | $76,456 | $8,000 | $68,456 |
| 2014 | $3,059 | $76,456 | $8,000 | $68,456 |
| 2013 | -- | $76,455 | $8,000 | $68,455 |
Source: Public Records
Map
Nearby Homes
- 0 E 46th St
- 913 E 46th St
- 717 E 44th St
- 346 Somers Ln
- 714 44th St E
- 0 44th St E
- 903 42nd St E
- 153 Belflower Rd
- 0 Belflower Rd Unit 25624433
- 0 Belflower Rd Unit 139026
- 0 Belflower Rd Unit 24022932
- 0 Belflower Rd Unit 138547
- 0 Belflower Rd Unit 10554704
- 2612 Goff St
- 2417 Belmont Ave
- 2411 Davis Ave
- 4620 Murray Ave
- 68 Rose Ave
- 0 Brighton Rd
- 2020 Davis Ave