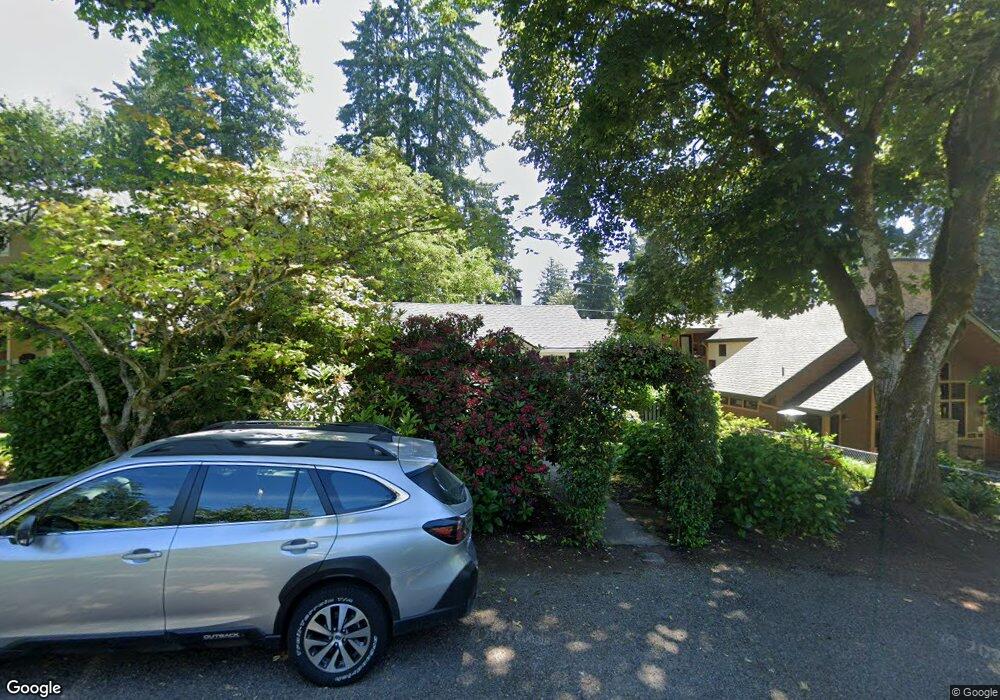
717 9th St Lake Oswego, OR 97034
Evergreen NeighborhoodEstimated Value: $837,152 - $986,000
1
Bed
1
Bath
936
Sq Ft
$983/Sq Ft
Est. Value
About This Home
This home is located at 717 9th St, Lake Oswego, OR 97034 and is currently estimated at $920,288, approximately $983 per square foot. 717 9th St is a home located in Clackamas County with nearby schools including Forest Hills Elementary School, Lake Oswego Junior High School, and Lake Oswego Senior High School.
Ownership History
Date
Name
Owned For
Owner Type
Purchase Details
Closed on
Apr 1, 1996
Sold by
Black Heidi E and Walker Douglas J
Bought by
Meyer David C and Meyer Myrnella H
Current Estimated Value
Purchase Details
Closed on
Oct 2, 1995
Sold by
Black Heidi E
Bought by
Black Heidi E and Walker Douglas J
Home Financials for this Owner
Home Financials are based on the most recent Mortgage that was taken out on this home.
Original Mortgage
$36,400
Interest Rate
7.92%
Mortgage Type
Purchase Money Mortgage
Create a Home Valuation Report for This Property
The Home Valuation Report is an in-depth analysis detailing your home's value as well as a comparison with similar homes in the area
Home Values in the Area
Average Home Value in this Area
Purchase History
| Date | Buyer | Sale Price | Title Company |
|---|---|---|---|
| Meyer David C | $155,000 | Chicago Title Insurance Co | |
| Black Heidi E | -- | Transamerica Title Insurance |
Source: Public Records
Mortgage History
| Date | Status | Borrower | Loan Amount |
|---|---|---|---|
| Previous Owner | Black Heidi E | $36,400 |
Source: Public Records
Tax History Compared to Growth
Tax History
| Year | Tax Paid | Tax Assessment Tax Assessment Total Assessment is a certain percentage of the fair market value that is determined by local assessors to be the total taxable value of land and additions on the property. | Land | Improvement |
|---|---|---|---|---|
| 2025 | $5,543 | $289,282 | -- | -- |
| 2024 | $5,395 | $280,857 | -- | -- |
| 2023 | $5,395 | $272,677 | $0 | $0 |
| 2022 | $5,082 | $264,735 | $0 | $0 |
| 2021 | $4,693 | $257,025 | $0 | $0 |
| 2020 | $4,575 | $249,539 | $0 | $0 |
| 2019 | $4,463 | $242,271 | $0 | $0 |
| 2018 | $4,244 | $235,215 | $0 | $0 |
| 2017 | $4,095 | $228,364 | $0 | $0 |
| 2016 | $3,727 | $221,713 | $0 | $0 |
| 2015 | $3,601 | $215,255 | $0 | $0 |
| 2014 | $3,554 | $208,985 | $0 | $0 |
Source: Public Records
Map
Nearby Homes