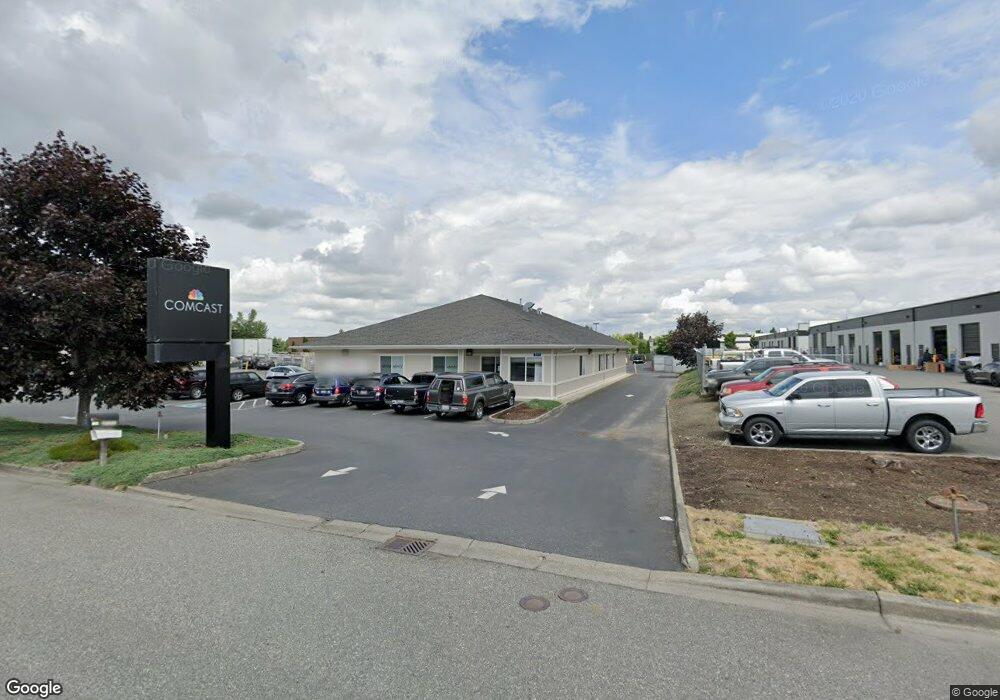
717 Bennett Rd Burlington, WA 98233
Estimated Value: $1,666,268
--
Bed
--
Bath
5,114
Sq Ft
$326/Sq Ft
Est. Value
About This Home
This home is located at 717 Bennett Rd, Burlington, WA 98233 and is currently estimated at $1,666,268, approximately $325 per square foot. 717 Bennett Rd is a home located in Skagit County with nearby schools including Burlington Edison High School, Salish Sea Deaf School, and Learning Ladder Child Development Center.
Ownership History
Date
Name
Owned For
Owner Type
Purchase Details
Closed on
Aug 25, 2022
Sold by
Weller Family Trust
Bought by
Keller Burlington Showroom Llc
Current Estimated Value
Home Financials for this Owner
Home Financials are based on the most recent Mortgage that was taken out on this home.
Original Mortgage
$1,031,250
Outstanding Balance
$987,256
Interest Rate
5.51%
Mortgage Type
New Conventional
Estimated Equity
$679,012
Purchase Details
Closed on
Aug 15, 2022
Sold by
Mclaughlin & Buty Llp
Bought by
Joseph T And Grace Mcgarrity Mclaughlin Trust and Weller Family Trust
Home Financials for this Owner
Home Financials are based on the most recent Mortgage that was taken out on this home.
Original Mortgage
$1,031,250
Outstanding Balance
$987,256
Interest Rate
5.51%
Mortgage Type
New Conventional
Estimated Equity
$679,012
Create a Home Valuation Report for This Property
The Home Valuation Report is an in-depth analysis detailing your home's value as well as a comparison with similar homes in the area
Home Values in the Area
Average Home Value in this Area
Purchase History
| Date | Buyer | Sale Price | Title Company |
|---|---|---|---|
| Keller Burlington Showroom Llc | -- | Chicago Title | |
| Joseph T And Grace Mcgarrity Mclaughlin Trust | -- | Chicago Title |
Source: Public Records
Mortgage History
| Date | Status | Borrower | Loan Amount |
|---|---|---|---|
| Open | Keller Burlington Showroom Llc | $1,031,250 |
Source: Public Records
Tax History Compared to Growth
Tax History
| Year | Tax Paid | Tax Assessment Tax Assessment Total Assessment is a certain percentage of the fair market value that is determined by local assessors to be the total taxable value of land and additions on the property. | Land | Improvement |
|---|---|---|---|---|
| 2024 | $11,600 | $1,294,300 | $548,900 | $745,400 |
| 2023 | $11,600 | $1,402,200 | $594,600 | $807,600 |
| 2022 | $9,643 | $1,263,300 | $548,900 | $714,400 |
| 2021 | $9,969 | $1,018,900 | $350,400 | $668,500 |
| 2020 | $10,589 | $976,500 | $0 | $0 |
| 2019 | $8,477 | $976,500 | $0 | $0 |
| 2018 | $10,901 | $821,200 | $0 | $0 |
| 2017 | $10,299 | $821,200 | $0 | $0 |
| 2016 | $9,496 | $793,400 | $292,000 | $501,400 |
| 2015 | $10,952 | $780,900 | $260,900 | $520,000 |
| 2013 | $11,188 | $780,900 | $0 | $0 |
Source: Public Records
Map
Nearby Homes
- 1205 S Walnut St
- 210 Gilkey Rd
- 0 Xxxxx Unit NWM2418778
- 1205 Decatur Cir Unit 2B
- 1159 Fidalgo Dr
- 1202 Decatur Cir Unit 20B
- 1191 Decatur Cir Unit 17B
- 1160 Decatur Cir
- 1032 Cypress Ct
- 1162 Sinclair Way Unit 55
- 1114 Sinclair Way Unit 63
- 721 S Alder St
- 800 Farmington Dr Unit 6
- 1033 Aspen Ln
- 448 Garden Ln Unit 44
- 425 Garden Ln Unit 39
- 0 NHN William Way Unit 85&86
- 2109 Sandalwood St
- 2021 N Laventure Rd Unit 304
- 718 N 1st St
- 1851 Bouslog Rd
- 1837 Bouslog Rd
- 1817 Bouslog Rd
- 1811 Bouslog Rd
- 777 Chrysler Dr
- 18381 W Whitmarsh Rd
- 1770 Bouslog Rd
- 680 McCorquedale Rd
- 784 McCorquedale Rd
- 680 W McCorquedale Rd
- 18381 W Whitmarsh Rd
- 18376 W McCorquedale Rd
- 18330 W McCorquedale Rd
- 18263 W Whitmarsh Rd
- 1651 Lindamood Ln
- 1667 Lindamood Ln
- 425 W Whitmarsh Rd
- 0 NHN George Hopper Rd
- 1633-1639 Lindamood Ln
- 18335 W McCorquedale Rd