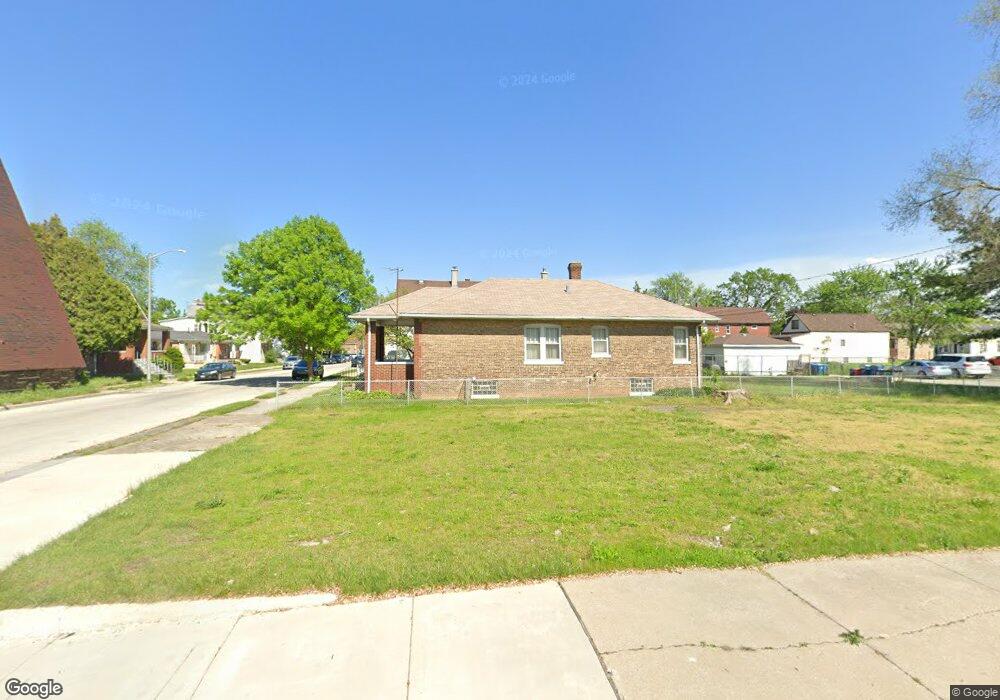
717 Burnham Ave Calumet City, IL 60409
Estimated Value: $143,000
--
Bed
--
Bath
--
Sq Ft
5,881
Sq Ft Lot
About This Home
This home is located at 717 Burnham Ave, Calumet City, IL 60409 and is currently estimated at $143,000. 717 Burnham Ave is a home located in Cook County with nearby schools including Lincoln Elementary School, Thornton Fractional North High School, and Hammond Academy Of Science & Tech.
Ownership History
Date
Name
Owned For
Owner Type
Purchase Details
Closed on
Oct 28, 2005
Sold by
First Nations Bank
Bought by
First Nations Bank and Trust #1645
Current Estimated Value
Home Financials for this Owner
Home Financials are based on the most recent Mortgage that was taken out on this home.
Original Mortgage
$110,000
Interest Rate
6.25%
Mortgage Type
Seller Take Back
Purchase Details
Closed on
Sep 27, 2005
Sold by
Mcwilliams Marshall
Bought by
First Nation Bank and Trust #1638
Home Financials for this Owner
Home Financials are based on the most recent Mortgage that was taken out on this home.
Original Mortgage
$110,000
Interest Rate
6.25%
Mortgage Type
Seller Take Back
Purchase Details
Closed on
Jul 2, 2004
Sold by
Mcwilliams Marshall
Bought by
Williams Sal
Purchase Details
Closed on
Oct 1, 2001
Sold by
Cole Taylor Bank
Bought by
Mcwilliams Marshall
Home Financials for this Owner
Home Financials are based on the most recent Mortgage that was taken out on this home.
Original Mortgage
$134,850
Interest Rate
8.25%
Mortgage Type
Commercial
Create a Home Valuation Report for This Property
The Home Valuation Report is an in-depth analysis detailing your home's value as well as a comparison with similar homes in the area
Home Values in the Area
Average Home Value in this Area
Purchase History
| Date | Buyer | Sale Price | Title Company |
|---|---|---|---|
| First Nations Bank | $130,000 | Ctic He | |
| First Nation Bank | -- | -- | |
| Williams Sal | -- | -- | |
| Mcwilliams Marshall | $90,000 | First American Title |
Source: Public Records
Mortgage History
| Date | Status | Borrower | Loan Amount |
|---|---|---|---|
| Previous Owner | First Nations Bank | $110,000 | |
| Previous Owner | Mcwilliams Marshall | $134,850 |
Source: Public Records
Tax History Compared to Growth
Tax History
| Year | Tax Paid | Tax Assessment Tax Assessment Total Assessment is a certain percentage of the fair market value that is determined by local assessors to be the total taxable value of land and additions on the property. | Land | Improvement |
|---|---|---|---|---|
| 2024 | $13,894 | $1,763 | $1,763 | -- |
| 2023 | $16,101 | $25,123 | $4,407 | $20,716 |
| 2022 | $16,101 | $22,241 | $9,549 | $12,692 |
| 2021 | $16,429 | $22,239 | $9,548 | $12,691 |
| 2020 | $15,321 | $22,239 | $9,548 | $12,691 |
| 2019 | $28,920 | $39,999 | $8,446 | $31,553 |
| 2018 | $28,503 | $39,999 | $8,446 | $31,553 |
| 2017 | $27,464 | $39,999 | $8,446 | $31,553 |
| 2016 | $10,229 | $15,818 | $7,712 | $8,106 |
| 2015 | $9,873 | $15,818 | $7,712 | $8,106 |
| 2014 | $7,336 | $11,764 | $7,712 | $4,052 |
| 2013 | $8,453 | $14,924 | $7,712 | $7,212 |
Source: Public Records
Map
Nearby Homes
- 719 Greenbay Ave
- 505 154th Place
- 502 154th Place
- 531 155th Place
- 708 May St
- 655 Hirsch Ave
- 775 Greenbay Ave
- 650 Greenbay Ave
- 531 156th St
- 518 156th Place
- 658 Mackinaw Ave
- 617 Hirsch Ave
- 650 Mackinaw Ave
- 611 Hirsch Ave
- 615 Price Ave
- 348 Pulaski Rd
- 510 157th St
- 580 Hirsch Ave
- 347 156th St
- 521 157th St
- 541 154th Place
- 539 154th Place
- 537 154th Place
- 524 156th St
- 533 154th Place
- 534 155th St
- 534 155th St
- 713 Burnham Ave
- 536 154th Place
- 531 154th Place
- 534 154th Place
- 532 154th Place
- 719 Greenbay Ave
- 719 Greenbay Ave
- 532 155th St
- 727 Greenbay Ave
- 525 154th Place
- 530 154th Place
- 713 Greenbay Ave
- 733 Greenbay Ave