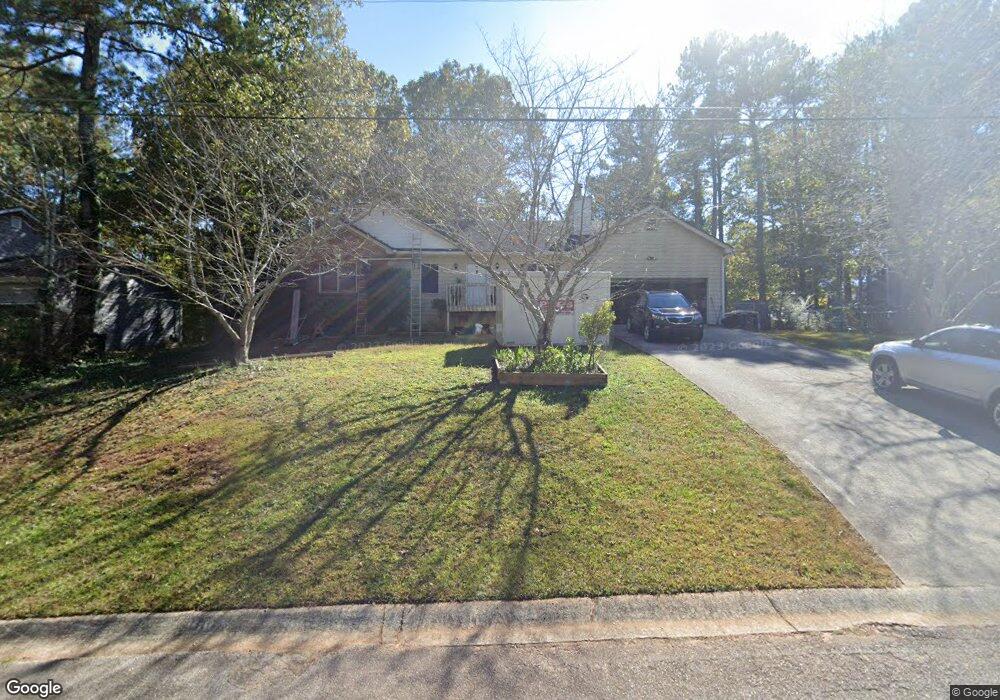
717 Deering Rd SE Unit 3 Conyers, GA 30094
Estimated Value: $220,736 - $255,000
3
Beds
2
Baths
1,262
Sq Ft
$188/Sq Ft
Est. Value
About This Home
This home is located at 717 Deering Rd SE Unit 3, Conyers, GA 30094 and is currently estimated at $236,934, approximately $187 per square foot. 717 Deering Rd SE Unit 3 is a home located in Rockdale County with nearby schools including Sims Elementary School, Edwards Middle School, and Heritage High School.
Ownership History
Date
Name
Owned For
Owner Type
Purchase Details
Closed on
Nov 9, 2022
Sold by
Hampton Bernard
Bought by
Hampton Bernard and Hampton Selina W
Current Estimated Value
Home Financials for this Owner
Home Financials are based on the most recent Mortgage that was taken out on this home.
Original Mortgage
$154,660
Outstanding Balance
$149,977
Interest Rate
7.08%
Mortgage Type
FHA
Estimated Equity
$86,957
Purchase Details
Closed on
Feb 21, 2001
Sold by
Dunn Lisa R
Bought by
Hampton Bernard
Home Financials for this Owner
Home Financials are based on the most recent Mortgage that was taken out on this home.
Original Mortgage
$70,320
Interest Rate
6.91%
Mortgage Type
New Conventional
Purchase Details
Closed on
May 11, 2000
Sold by
Dunn Jackie E
Bought by
Dunn Lisa R
Create a Home Valuation Report for This Property
The Home Valuation Report is an in-depth analysis detailing your home's value as well as a comparison with similar homes in the area
Home Values in the Area
Average Home Value in this Area
Purchase History
| Date | Buyer | Sale Price | Title Company |
|---|---|---|---|
| Hampton Bernard | -- | -- | |
| Hampton Bernard | $87,900 | -- | |
| Dunn Lisa R | -- | -- |
Source: Public Records
Mortgage History
| Date | Status | Borrower | Loan Amount |
|---|---|---|---|
| Open | Hampton Bernard | $154,660 | |
| Previous Owner | Hampton Bernard | $70,320 |
Source: Public Records
Tax History Compared to Growth
Tax History
| Year | Tax Paid | Tax Assessment Tax Assessment Total Assessment is a certain percentage of the fair market value that is determined by local assessors to be the total taxable value of land and additions on the property. | Land | Improvement |
|---|---|---|---|---|
| 2024 | $2,015 | $85,880 | $18,480 | $67,400 |
| 2023 | $1,494 | $68,080 | $12,800 | $55,280 |
| 2022 | $1,218 | $57,320 | $12,800 | $44,520 |
| 2021 | $1,002 | $46,840 | $8,960 | $37,880 |
| 2020 | $844 | $42,560 | $8,600 | $33,960 |
| 2019 | $406 | $27,640 | $4,680 | $22,960 |
| 2018 | $379 | $26,680 | $4,680 | $22,000 |
| 2017 | $295 | $23,840 | $4,680 | $19,160 |
| 2016 | $273 | $23,840 | $4,680 | $19,160 |
| 2015 | $358 | $26,720 | $4,680 | $22,040 |
| 2014 | $357 | $27,920 | $3,960 | $23,960 |
| 2013 | -- | $26,560 | $4,840 | $21,720 |
Source: Public Records
Map
Nearby Homes
- 693 Deering Rd SE
- 2924 Raintree Dr SE
- 2923 Raintree Dr SE
- 665 Huron Ct SE
- 820 Bridgewater Way SE
- 1813 Holmsey Cir
- 812 Raintree Way SE
- 726 Shoreline Trail SE
- 2987 Landmark Dr SE
- 3021 Lakeridge Dr SE
- 3014 Lakeridge Dr SE
- 3027 Lakeridge Dr SE
- 917 Curry Cir SE
- 574 Almand Branch Rd SE Unit 1
- 549 Greenview Ave SE
- 1920 Logan Ln
- 2717 Stanton Woods Dr SE
- 2910 Stanton Rd SE
- 2851 Stanton Rd SE
- 1511 Hillside Dr SE
- 727 Deering Rd SE
- 727 Deering Rd SE Unit 26A
- 709 Deering Rd SE Unit 3
- 720 Lakeridge Dr SE Unit 2
- 712 Lakeridge Dr SE
- 707 Deering Rd SE Unit 3
- 704 Lakeridge Dr SE Unit 2
- 710 Deering Rd SE
- 737 Deering Rd SE
- 737 Deering Rd SE Unit F
- 698 Lakeridge Dr SE
- 698 Lakeridge Dr SE Unit 2
- 690 Lakeridge Dr SE Unit 2
- 700 Deering Rd SE Unit 2
- 2914 Landmark Dr SE
- 683 Deering Rd SE
- 684 Lakeridge Dr SE
- 705 Greenview Ave SE
- 678 Lakeridge Dr SE
- 2920 Landmark Dr SE