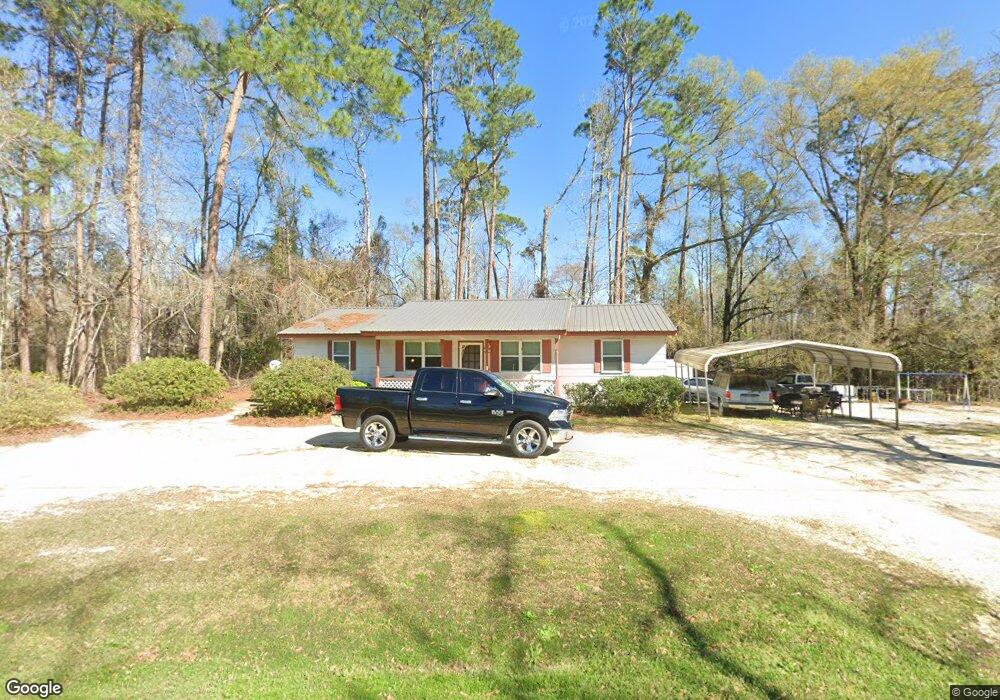
717 Durden Rd Twin City, GA 30471
Estimated Value: $78,000 - $108,464
3
Beds
2
Baths
1,152
Sq Ft
$86/Sq Ft
Est. Value
About This Home
This home is located at 717 Durden Rd, Twin City, GA 30471 and is currently estimated at $98,616, approximately $85 per square foot. 717 Durden Rd is a home with nearby schools including Twin City Elementary School.
Ownership History
Date
Name
Owned For
Owner Type
Purchase Details
Closed on
Apr 28, 2008
Sold by
Arcola Investments Llc
Bought by
Fountain Charles M
Current Estimated Value
Purchase Details
Closed on
Jul 17, 2006
Sold by
Brady Jule
Bought by
Sapp Latoya and Sapp Leon
Home Financials for this Owner
Home Financials are based on the most recent Mortgage that was taken out on this home.
Original Mortgage
$40,358
Interest Rate
6.6%
Mortgage Type
New Conventional
Purchase Details
Closed on
Aug 19, 2005
Sold by
Fountain Charles M
Bought by
Arcola Investments Llc
Purchase Details
Closed on
Sep 3, 2002
Sold by
Lendmark Financial S
Bought by
Bady Jule
Purchase Details
Closed on
Mar 7, 2002
Sold by
Gatson Eugene
Bought by
Lendmark Financial S
Purchase Details
Closed on
Jan 21, 1995
Sold by
Jim Walter Homes In
Bought by
Gatson Eugene
Purchase Details
Closed on
Jan 3, 1995
Sold by
Wade William J Trust
Bought by
Jim Walter Homes Inc
Create a Home Valuation Report for This Property
The Home Valuation Report is an in-depth analysis detailing your home's value as well as a comparison with similar homes in the area
Home Values in the Area
Average Home Value in this Area
Purchase History
| Date | Buyer | Sale Price | Title Company |
|---|---|---|---|
| Fountain Charles M | -- | -- | |
| Sapp Latoya | $51,500 | -- | |
| Arcola Investments Llc | -- | -- | |
| Bady Jule | $38,000 | -- | |
| Lendmark Financial S | $44,600 | -- | |
| Gatson Eugene | $24,000 | -- | |
| Jim Walter Homes Inc | $2,000 | -- |
Source: Public Records
Mortgage History
| Date | Status | Borrower | Loan Amount |
|---|---|---|---|
| Previous Owner | Sapp Latoya | $40,358 |
Source: Public Records
Tax History Compared to Growth
Tax History
| Year | Tax Paid | Tax Assessment Tax Assessment Total Assessment is a certain percentage of the fair market value that is determined by local assessors to be the total taxable value of land and additions on the property. | Land | Improvement |
|---|---|---|---|---|
| 2024 | $850 | $26,038 | $2,088 | $23,950 |
| 2023 | $127 | $23,006 | $2,088 | $20,918 |
| 2022 | $523 | $20,966 | $2,088 | $18,878 |
| 2021 | $491 | $19,421 | $1,815 | $17,606 |
| 2020 | $649 | $24,139 | $3,698 | $20,441 |
| 2019 | $645 | $24,139 | $3,698 | $20,441 |
| 2018 | $662 | $24,139 | $3,698 | $20,441 |
| 2017 | $664 | $24,139 | $3,698 | $20,441 |
| 2016 | $607 | $24,079 | $3,698 | $20,381 |
| 2015 | -- | $23,326 | $2,978 | $20,347 |
| 2014 | -- | $23,000 | $2,978 | $20,022 |
| 2013 | -- | $21,414 | $1,895 | $19,518 |
Source: Public Records
Map
Nearby Homes
- 211 6th Ave
- 912 5th Ave
- 317 5th Ave
- 1120 5th Ave
- 0 Scarboro Church Rd Unit 25066343
- 519 Wilson Rd
- S S Old Reidsville Rd
- 889 Ga Highway 192 N
- 211 S Railroad St
- 56 Rock Creek Rd
- 184 Eagle Pass
- 405 Monroe St
- 3770 Hill Rd
- 11 Plantation Dr
- 1073 Hawhammock Ch Rd
- 875 Prosperity Dr
- 760 Memphis Rd
- 0 S Old Reidsville Rd Unit 10556290
- 849 Prosperity Dr
- 843 Prosperity Dr
- 724 Durden Rd
- 747 Durden Rd
- 737 Durden Rd
- 729 Durden Rd
- 118 Mathis St
- 621 Elm St
- 402 6th Ave
- 0 Mathis St Unit 7237726
- 734 Durden Rd
- 730 Durden Rd
- 611 S College St
- 618 Mathis St
- 739 Durden Rd
- 785 Rainbow Ridge
- 608 S College St
- 639 Railroad Ave
- 746 S Old Reidsville Rd
- 218 Mathis St
- 612 S Swift St
- 787 Rainbow Ridge