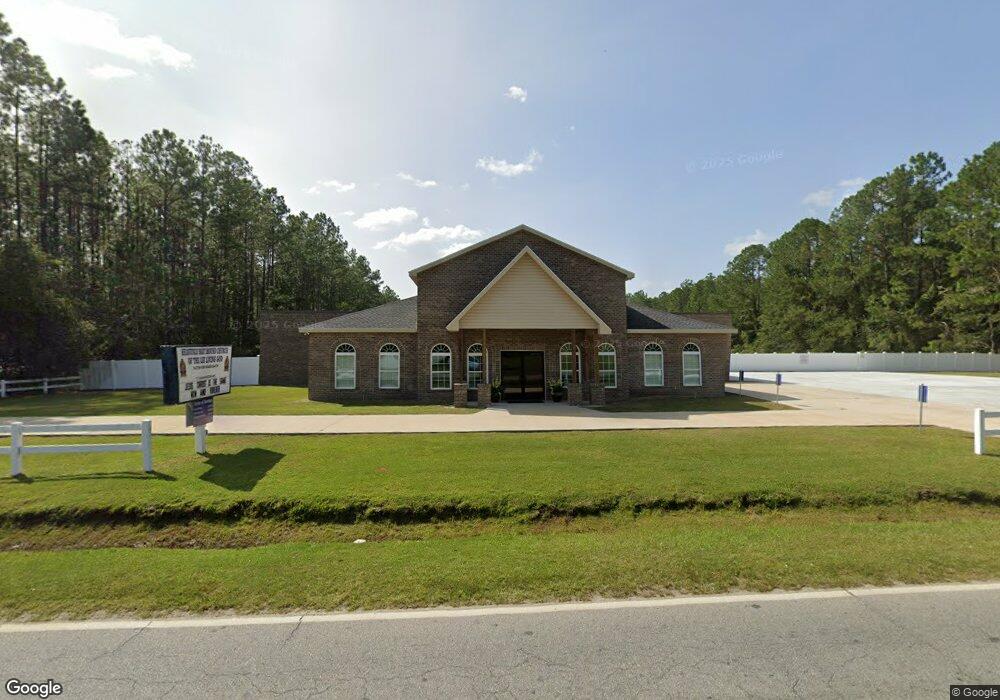
717 Garlington Ave Waycross, GA 31503
Estimated Value: $198,719
--
Bed
--
Bath
3,000
Sq Ft
$66/Sq Ft
Est. Value
About This Home
This home is located at 717 Garlington Ave, Waycross, GA 31503 and is currently priced at $198,719, approximately $66 per square foot. 717 Garlington Ave is a home located in Ware County with nearby schools including Waresboro Elementary School, Ware County Middle School, and Ware County High School.
Ownership History
Date
Name
Owned For
Owner Type
Purchase Details
Closed on
Jan 7, 2021
Sold by
Smith Roger
Bought by
Heavenly Bound Church Of The Living God
Current Estimated Value
Purchase Details
Closed on
Sep 11, 2017
Sold by
Brigmond John H
Bought by
Smith Roger
Purchase Details
Closed on
Nov 4, 2005
Sold by
Bass Roy E
Bought by
Brigmond John H
Home Financials for this Owner
Home Financials are based on the most recent Mortgage that was taken out on this home.
Original Mortgage
$132,000
Interest Rate
5.9%
Mortgage Type
Commercial
Purchase Details
Closed on
Dec 28, 2001
Sold by
Bass L H & Sons Elec Inc
Bought by
Bass Roy E
Purchase Details
Closed on
Nov 19, 2001
Sold by
Son Bass L and Son Elect
Bought by
Bass Roy E
Purchase Details
Closed on
Mar 2, 1994
Sold by
Wayx Ware Co Dev Aut
Bought by
Son Bass L and Son Elect
Create a Home Valuation Report for This Property
The Home Valuation Report is an in-depth analysis detailing your home's value as well as a comparison with similar homes in the area
Home Values in the Area
Average Home Value in this Area
Purchase History
| Date | Buyer | Sale Price | Title Company |
|---|---|---|---|
| Heavenly Bound Church Of The Living God | -- | -- | |
| Smith Roger | $110,000 | -- | |
| Brigmond John H | $150,000 | -- | |
| Bass Roy E | -- | -- | |
| Bass Roy E | -- | -- | |
| Son Bass L | -- | -- |
Source: Public Records
Mortgage History
| Date | Status | Borrower | Loan Amount |
|---|---|---|---|
| Previous Owner | Brigmond John H | $132,000 |
Source: Public Records
Tax History Compared to Growth
Tax History
| Year | Tax Paid | Tax Assessment Tax Assessment Total Assessment is a certain percentage of the fair market value that is determined by local assessors to be the total taxable value of land and additions on the property. | Land | Improvement |
|---|---|---|---|---|
| 2024 | -- | $305,860 | $27,443 | $278,417 |
| 2023 | $0 | $239,232 | $27,443 | $211,789 |
| 2022 | $9,363 | $234,947 | $27,443 | $207,504 |
| 2021 | $3,940 | $91,115 | $27,443 | $63,672 |
| 2020 | $3,971 | $91,115 | $27,443 | $63,672 |
| 2019 | $2,430 | $54,976 | $27,443 | $27,533 |
| 2018 | $1,964 | $54,976 | $27,443 | $27,533 |
| 2017 | $2,397 | $54,976 | $27,443 | $27,533 |
| 2016 | $2,397 | $54,976 | $27,443 | $27,533 |
| 2015 | $2,414 | $54,975 | $27,443 | $27,533 |
| 2014 | $2,411 | $54,976 | $27,443 | $27,533 |
| 2013 | -- | $54,975 | $27,442 | $27,532 |
Source: Public Records
Map
Nearby Homes
- 00 Roosevelt St
- 0 Camp Branch Cross Rd Unit 147575
- 0 Camp Branch Cross Rd Unit 10127958
- 6905 Kendal Ct
- 1702 Albany Ave
- 605 Walker St
- 1322 Jane St
- 1006 Roosevelt St
- 0 S Georgia Pkwy W
- 1003 Carswell Ave
- 505 N Nicholls St
- 503 N Nicholls St
- 1027 Robert St
- 1208 Margaret St
- 1803 Lamar Ave
- 506 McDonald St
- 1601 Genoa St
- 629 Remshart St
- 516 Folks St
- 812 Effie St
- 1509 Ketterer St
- 1425 Ketterer St
- 1419 Ketterer St
- 1502 Roosevelt St
- 1413 Ketterer St
- 707 Garlington Ave
- 00 Ketterer Street Lot
- 1512 Roosevelt St
- 1418 Roosevelt St
- 1409 Ketterer St
- 1520 Roosevelt St
- 1414 Roosevelt St
- 1410 Roosevelt St
- 1405 Ketterer St
- 1527 N Ketterer
- 1507 Roosevelt St
- 1527 Ketterer St
- 1503 Roosevelt St
- 1408 Roosevelt St
- 1505 Roosevelt St