
Seller's Agent in 2019
Jenessa Kell
John L Scott LVW
(360) 703-4618
9 Total Sales

Estimated Value: $808,000 - $1,004,661
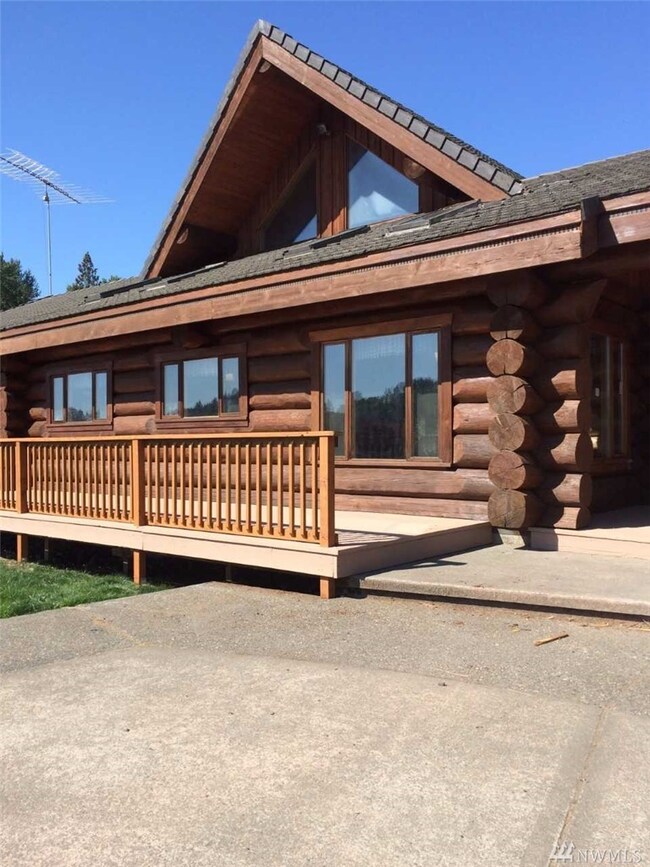
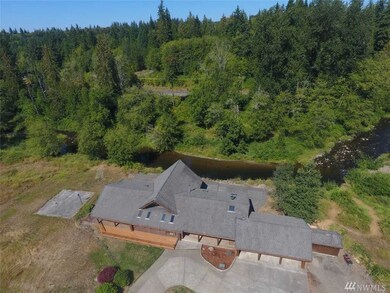
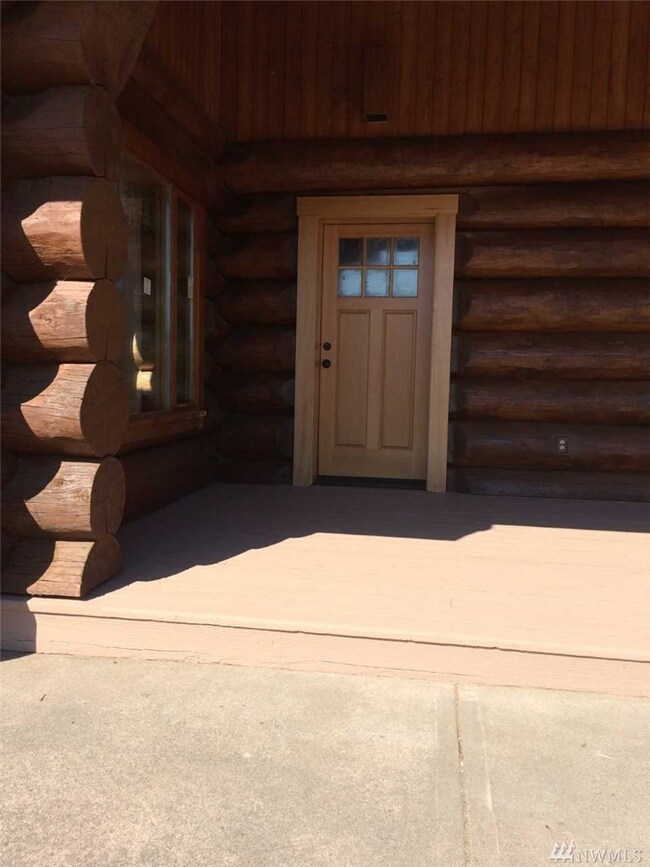
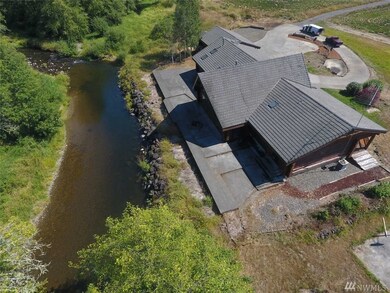
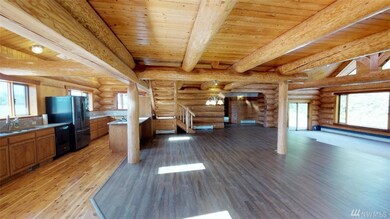
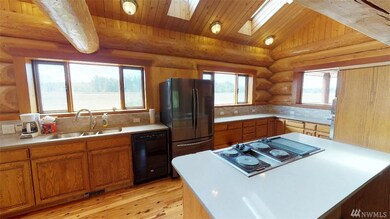
Back on market, at no fault of seller! Custom log home. Open living area. 5.12 acres! Completely updated w/ new quartz counter tops, tile shower, flooring and more. 4 sliding glass doors to Large back patio just feet from the river, large covered front porch, master suite on the main level with full bath, sky lights & more. Heating sources include; Ht Pump, & Hydronic. 3 bay car-port. Only 20 mins. from Mayfield, & Rife lake. room for Barn or stables...! Must see to appreciate.
Source: Northwest Multiple Listing Service (NWMLS)
MLS#: NWM1356158
| Date | Buyer | Sale Price | Title Company |
|---|---|---|---|
| Petterson Cynthia L | $459,900 | Stewart Title Company | |
| Bk Allday Llc | $259,900 | Lewis County Title | |
| Bk Allday Llc | -- | New Title Company Name |
| Date | Status | Borrower | Loan Amount |
|---|---|---|---|
| Open | Petterson Cynthia L | $467,948 |
| Date | Event | Price | List to Sale | Price per Sq Ft | Prior Sale |
|---|---|---|---|---|---|
| 08/02/2019 08/02/19 | Sold | $459,900 | 0.0% | $120 / Sq Ft | |
| 07/03/2019 07/03/19 | Pending | -- | -- | -- | |
| 06/18/2019 06/18/19 | Price Changed | $459,900 | +2.2% | $120 / Sq Ft | |
| 06/17/2019 06/17/19 | For Sale | $449,900 | 0.0% | $117 / Sq Ft | |
| 05/21/2019 05/21/19 | Pending | -- | -- | -- | |
| 05/16/2019 05/16/19 | Price Changed | $449,900 | -3.2% | $117 / Sq Ft | |
| 05/10/2019 05/10/19 | Price Changed | $464,900 | -2.1% | $121 / Sq Ft | |
| 05/03/2019 05/03/19 | Price Changed | $474,900 | -5.0% | $123 / Sq Ft | |
| 04/28/2019 04/28/19 | Price Changed | $499,900 | -4.8% | $130 / Sq Ft | |
| 04/23/2019 04/23/19 | Price Changed | $524,900 | -3.3% | $136 / Sq Ft | |
| 03/13/2019 03/13/19 | Price Changed | $542,900 | -1.3% | $141 / Sq Ft | |
| 02/20/2019 02/20/19 | Price Changed | $549,900 | -1.8% | $143 / Sq Ft | |
| 02/01/2019 02/01/19 | Price Changed | $559,900 | -2.3% | $146 / Sq Ft | |
| 01/25/2019 01/25/19 | Price Changed | $572,900 | -1.2% | $149 / Sq Ft | |
| 01/19/2019 01/19/19 | Price Changed | $579,900 | -0.9% | $151 / Sq Ft | |
| 01/07/2019 01/07/19 | Price Changed | $584,900 | -0.8% | $152 / Sq Ft | |
| 11/14/2018 11/14/18 | Price Changed | $589,900 | -1.7% | $153 / Sq Ft | |
| 10/23/2018 10/23/18 | Price Changed | $599,900 | -4.0% | $156 / Sq Ft | |
| 10/11/2018 10/11/18 | Price Changed | $624,900 | -3.7% | $162 / Sq Ft | |
| 09/05/2018 09/05/18 | For Sale | $649,000 | +149.7% | $169 / Sq Ft | |
| 11/30/2017 11/30/17 | Sold | $259,900 | 0.0% | $68 / Sq Ft | View Prior Sale |
| 10/31/2017 10/31/17 | Pending | -- | -- | -- | |
| 10/17/2017 10/17/17 | Price Changed | $259,900 | -7.1% | $68 / Sq Ft | |
| 09/19/2017 09/19/17 | Price Changed | $279,900 | 0.0% | $73 / Sq Ft | |
| 09/19/2017 09/19/17 | For Sale | $279,900 | +7.7% | $73 / Sq Ft | |
| 09/17/2017 09/17/17 | Off Market | $259,900 | -- | -- | |
| 09/07/2017 09/07/17 | For Sale | $299,900 | 0.0% | $78 / Sq Ft | |
| 07/18/2017 07/18/17 | Pending | -- | -- | -- | |
| 06/16/2017 06/16/17 | Price Changed | $299,900 | 0.0% | $78 / Sq Ft | |
| 06/16/2017 06/16/17 | For Sale | $299,900 | +15.4% | $78 / Sq Ft | |
| 06/16/2017 06/16/17 | Off Market | $259,900 | -- | -- | |
| 05/03/2017 05/03/17 | Price Changed | $399,900 | -9.1% | $104 / Sq Ft | |
| 04/06/2017 04/06/17 | Price Changed | $440,100 | -10.2% | $114 / Sq Ft | |
| 04/03/2017 04/03/17 | For Sale | $490,050 | +88.6% | $127 / Sq Ft | |
| 02/21/2017 02/21/17 | Off Market | $259,900 | -- | -- | |
| 02/16/2017 02/16/17 | For Sale | $490,050 | -- | $127 / Sq Ft |
| Year | Tax Paid | Tax Assessment Tax Assessment Total Assessment is a certain percentage of the fair market value that is determined by local assessors to be the total taxable value of land and additions on the property. | Land | Improvement |
|---|---|---|---|---|
| 2025 | $6,426 | $949,800 | $197,600 | $752,200 |
| 2024 | $6,426 | $909,700 | $206,400 | $703,300 |
| 2023 | $6,462 | $879,200 | $152,100 | $727,100 |
| 2022 | $5,691 | $665,000 | $120,500 | $544,500 |
| 2021 | $5,163 | $665,000 | $120,500 | $544,500 |
| 2020 | $5,158 | $584,800 | $100,400 | $484,400 |
| 2019 | $11,391 | $550,000 | $100,400 | $449,600 |
| 2018 | $2,288 | $543,800 | $88,100 | $455,700 |
| 2017 | $4,576 | $506,100 | $73,000 | $433,100 |
| 2016 | $3,818 | $463,200 | $69,500 | $393,700 |
| 2015 | $3,562 | $424,100 | $66,200 | $357,900 |
| 2013 | $3,562 | $425,500 | $66,200 | $359,300 |
Seller's Agent in 2019
Jenessa Kell
John L Scott LVW
(360) 703-4618
9 Total Sales
B
Seller Co-Listing Agent in 2019
Bruce Kell
John L Scott LVW
(253) 640-0669
1 Total Sale
Buyer's Agent in 2019
Susan Wood
John L. Scott, Inc.
(360) 430-9373
178 Total Sales
Seller's Agent in 2017
Martha Wright
eXp Realty
(360) 520-5251
76 Total Sales
Source: Northwest Multiple Listing Service (NWMLS)
MLS Number: NWM1356158
APN: 017404-002-002
Disclaimer: Certain information contained herein is derived from information provided by parties other than Homes.com. All information provided is deemed reliable, but is not guaranteed to be accurate and should be independently verified.
![]() All data is obtained from various sources and may not have been verified by broker or MLS GRID. Supplied Open House Information is subject to change without notice. All information should be independently reviewed and verified for accuracy. Properties may or may not be listed by the office/agent presenting the information. Listing information is provided by the Northwest Multiple Listing Service (NWMLS). Property information is based on available data that may include MLS information, county records, and other sources. Listings marked with the 3 tree icon and provided by NWMLS. All properties are subject to prior sale or withdrawal. IDX information is provided exclusively for consumers’ personal noncommercial use, that it may not be used for any purpose other than to identify prospective properties consumers may be interested in purchasing, that the data is deemed reliable but is not guaranteed by MLS GRID. ©2026 NWMLS.
All data is obtained from various sources and may not have been verified by broker or MLS GRID. Supplied Open House Information is subject to change without notice. All information should be independently reviewed and verified for accuracy. Properties may or may not be listed by the office/agent presenting the information. Listing information is provided by the Northwest Multiple Listing Service (NWMLS). Property information is based on available data that may include MLS information, county records, and other sources. Listings marked with the 3 tree icon and provided by NWMLS. All properties are subject to prior sale or withdrawal. IDX information is provided exclusively for consumers’ personal noncommercial use, that it may not be used for any purpose other than to identify prospective properties consumers may be interested in purchasing, that the data is deemed reliable but is not guaranteed by MLS GRID. ©2026 NWMLS.
Based on information submitted to the MLS GRID
Ask me questions while you tour the home.