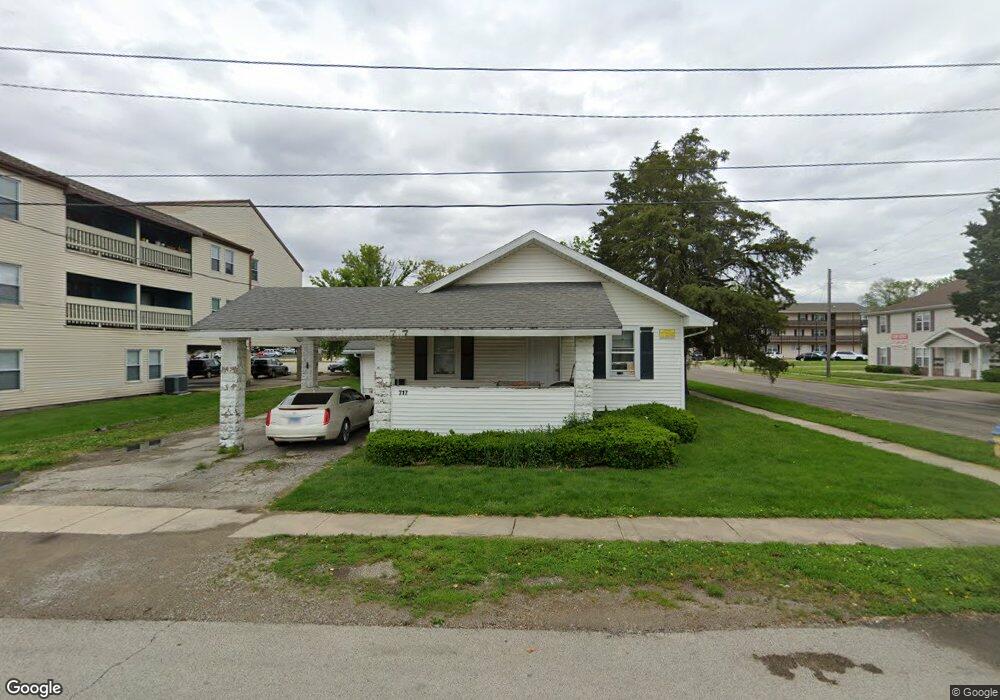
717 Grant Ave Charleston, IL 61920
Estimated Value: $78,000 - $116,000
4
Beds
3
Baths
1,120
Sq Ft
$85/Sq Ft
Est. Value
About This Home
This home is located at 717 Grant Ave, Charleston, IL 61920 and is currently estimated at $95,333, approximately $85 per square foot. 717 Grant Ave is a home located in Coles County with nearby schools including Charleston High School and Charleston Christian Academy.
Ownership History
Date
Name
Owned For
Owner Type
Purchase Details
Closed on
Oct 14, 2022
Sold by
Village Pointe Llc and Mlm Properties Llc
Bought by
Gharu Capital Llc
Current Estimated Value
Home Financials for this Owner
Home Financials are based on the most recent Mortgage that was taken out on this home.
Original Mortgage
$618,918
Interest Rate
6.78%
Mortgage Type
New Conventional
Purchase Details
Closed on
Nov 15, 2006
Sold by
First Mid Illinois Bank & Trust Na
Bought by
Mlm Properties Llc
Purchase Details
Closed on
May 31, 2005
Sold by
Darding Roger L and Roger L Darding Declaration Of
Bought by
First Mid Illinois Bank & Trust N A and Trust Number 44 0526 70
Create a Home Valuation Report for This Property
The Home Valuation Report is an in-depth analysis detailing your home's value as well as a comparison with similar homes in the area
Home Values in the Area
Average Home Value in this Area
Purchase History
| Date | Buyer | Sale Price | Title Company |
|---|---|---|---|
| Gharu Capital Llc | $740,000 | None Listed On Document | |
| Mlm Properties Llc | -- | None Available | |
| First Mid Illinois Bank & Trust N A | $598,500 | None Available |
Source: Public Records
Mortgage History
| Date | Status | Borrower | Loan Amount |
|---|---|---|---|
| Previous Owner | Gharu Capital Llc | $618,918 |
Source: Public Records
Tax History Compared to Growth
Tax History
| Year | Tax Paid | Tax Assessment Tax Assessment Total Assessment is a certain percentage of the fair market value that is determined by local assessors to be the total taxable value of land and additions on the property. | Land | Improvement |
|---|---|---|---|---|
| 2024 | $2,000 | $25,777 | $5,221 | $20,556 |
| 2023 | $1,970 | $23,541 | $4,768 | $18,773 |
| 2022 | $1,974 | $23,152 | $4,689 | $18,463 |
| 2021 | $2,033 | $22,219 | $4,500 | $17,719 |
| 2020 | $2,069 | $23,021 | $4,870 | $18,151 |
| 2019 | $2,035 | $22,219 | $4,700 | $17,519 |
| 2018 | $2,014 | $22,219 | $4,700 | $17,519 |
| 2017 | $1,987 | $22,219 | $4,700 | $17,519 |
| 2016 | $1,970 | $22,219 | $4,700 | $17,519 |
| 2015 | $2,034 | $22,219 | $4,700 | $17,519 |
| 2014 | $2,034 | $22,219 | $4,700 | $17,519 |
| 2013 | $2,034 | $22,219 | $4,700 | $17,519 |
Source: Public Records
Map
Nearby Homes