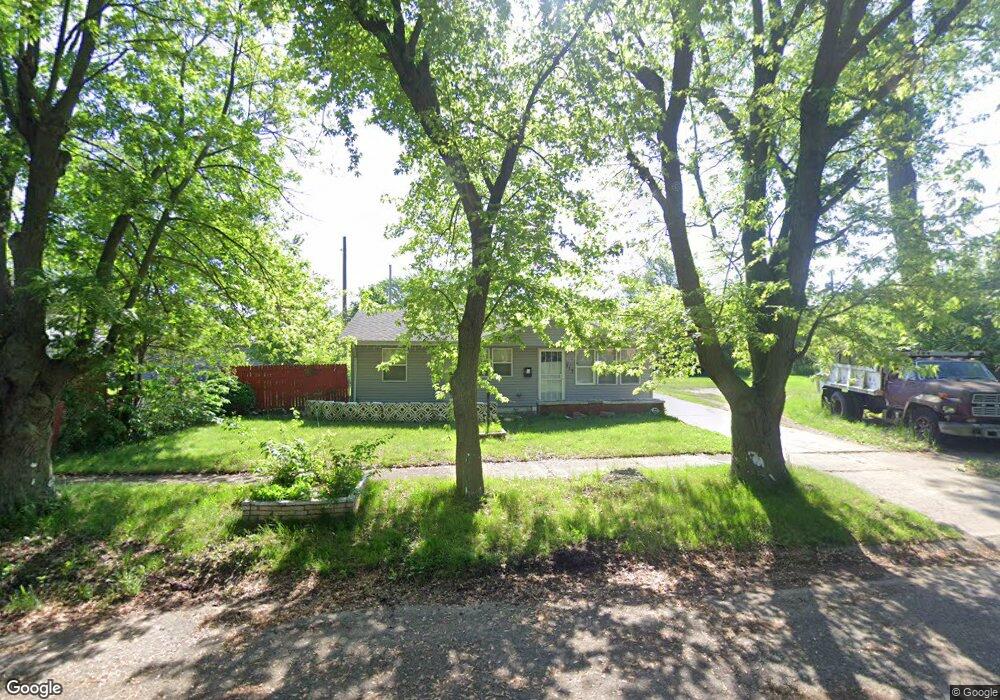
717 Hamlin St Gary, IN 46406
Brunswick NeighborhoodEstimated Value: $94,722 - $132,000
3
Beds
1
Bath
1,073
Sq Ft
$106/Sq Ft
Est. Value
About This Home
This home is located at 717 Hamlin St, Gary, IN 46406 and is currently estimated at $113,431, approximately $105 per square foot. 717 Hamlin St is a home located in Lake County with nearby schools including Bailly Preparatory Academy, West Side Leadership Academy, and Gary Lighthouse Charter School.
Ownership History
Date
Name
Owned For
Owner Type
Purchase Details
Closed on
Feb 8, 2019
Sold by
Element Real Estate Professional Service
Bought by
Clark Clara
Current Estimated Value
Home Financials for this Owner
Home Financials are based on the most recent Mortgage that was taken out on this home.
Original Mortgage
$65,786
Outstanding Balance
$58,216
Interest Rate
5.12%
Mortgage Type
FHA
Estimated Equity
$55,215
Purchase Details
Closed on
Dec 8, 2015
Sold by
Hunter Jessie J and Hunter Jannie
Bought by
Eleent Real Estate Professional Services
Create a Home Valuation Report for This Property
The Home Valuation Report is an in-depth analysis detailing your home's value as well as a comparison with similar homes in the area
Home Values in the Area
Average Home Value in this Area
Purchase History
| Date | Buyer | Sale Price | Title Company |
|---|---|---|---|
| Clark Clara | -- | Indiana Title Network Co | |
| Eleent Real Estate Professional Services | $1,000 | None Available |
Source: Public Records
Mortgage History
| Date | Status | Borrower | Loan Amount |
|---|---|---|---|
| Open | Clark Clara | $65,786 |
Source: Public Records
Tax History
| Year | Tax Paid | Tax Assessment Tax Assessment Total Assessment is a certain percentage of the fair market value that is determined by local assessors to be the total taxable value of land and additions on the property. | Land | Improvement |
|---|---|---|---|---|
| 2025 | $609 | $55,200 | $7,900 | $47,300 |
| 2024 | $4,303 | $50,300 | $8,200 | $42,100 |
| 2023 | $534 | $48,800 | $8,200 | $40,600 |
| 2022 | $534 | $46,600 | $5,200 | $41,400 |
| 2021 | $530 | $46,200 | $5,200 | $41,000 |
| 2020 | $519 | $45,300 | $5,200 | $40,100 |
| 2019 | $876 | $40,800 | $5,200 | $35,600 |
| 2018 | $926 | $40,800 | $5,200 | $35,600 |
| 2017 | $957 | $41,500 | $5,200 | $36,300 |
| 2016 | $1,043 | $46,100 | $5,200 | $40,900 |
| 2014 | $1,479 | $63,200 | $5,700 | $57,500 |
| 2013 | $1,420 | $63,200 | $5,700 | $57,500 |
Source: Public Records
Map
Nearby Homes
Your Personal Tour Guide
Ask me questions while you tour the home.