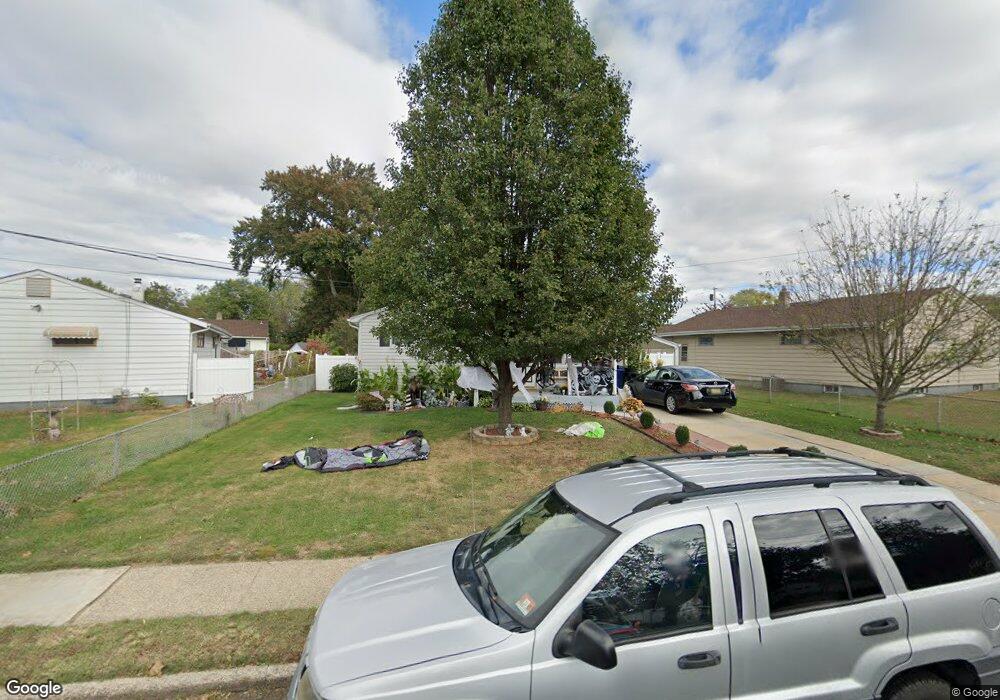
717 Holly Ln Mount Holly, NJ 08060
Estimated Value: $275,899 - $307,000
Studio
--
Bath
952
Sq Ft
$306/Sq Ft
Est. Value
About This Home
This home is located at 717 Holly Ln, Mount Holly, NJ 08060 and is currently estimated at $291,225, approximately $305 per square foot. 717 Holly Ln is a home located in Burlington County with nearby schools including John Brainerd Elementary School, Folwell Elementary School, and F.W. Holbein School.
Ownership History
Date
Name
Owned For
Owner Type
Purchase Details
Closed on
Mar 11, 2014
Sold by
Torres Francisco and Torres Franciso J
Bought by
Torres Francisco J and Torres Robin
Current Estimated Value
Home Financials for this Owner
Home Financials are based on the most recent Mortgage that was taken out on this home.
Original Mortgage
$176,274
Outstanding Balance
$135,659
Interest Rate
4.75%
Mortgage Type
FHA
Estimated Equity
$155,566
Purchase Details
Closed on
Aug 27, 2003
Sold by
Berdugo Tomas W
Bought by
Torres Francisco
Home Financials for this Owner
Home Financials are based on the most recent Mortgage that was taken out on this home.
Original Mortgage
$125,910
Interest Rate
6.43%
Mortgage Type
Purchase Money Mortgage
Purchase Details
Closed on
Mar 21, 2003
Sold by
Egley Theresa H
Bought by
Berdugo Tomas W
Create a Home Valuation Report for This Property
The Home Valuation Report is an in-depth analysis detailing your home's value as well as a comparison with similar homes in the area
Home Values in the Area
Average Home Value in this Area
Purchase History
| Date | Buyer | Sale Price | Title Company |
|---|---|---|---|
| Torres Francisco J | -- | None Available | |
| Torres Francisco | $139,900 | -- | |
| Berdugo Tomas W | $65,000 | -- |
Source: Public Records
Mortgage History
| Date | Status | Borrower | Loan Amount |
|---|---|---|---|
| Open | Torres Francisco J | $176,274 | |
| Previous Owner | Torres Francisco | $125,910 |
Source: Public Records
Tax History
| Year | Tax Paid | Tax Assessment Tax Assessment Total Assessment is a certain percentage of the fair market value that is determined by local assessors to be the total taxable value of land and additions on the property. | Land | Improvement |
|---|---|---|---|---|
| 2025 | $5,259 | $149,800 | $47,000 | $102,800 |
| 2024 | $5,027 | $149,800 | $47,000 | $102,800 |
| 2023 | $5,027 | $149,800 | $47,000 | $102,800 |
| 2022 | $4,851 | $149,800 | $47,000 | $102,800 |
| 2021 | $4,771 | $149,800 | $47,000 | $102,800 |
| 2020 | $4,585 | $149,800 | $47,000 | $102,800 |
| 2019 | $4,482 | $149,800 | $47,000 | $102,800 |
| 2018 | $4,403 | $149,800 | $47,000 | $102,800 |
| 2017 | $4,289 | $149,800 | $47,000 | $102,800 |
| 2016 | $4,190 | $149,800 | $47,000 | $102,800 |
| 2015 | $4,102 | $149,800 | $47,000 | $102,800 |
| 2014 | $3,950 | $149,800 | $47,000 | $102,800 |
Source: Public Records
Map
Nearby Homes
- 817 Woodlane Rd
- 34 Parliament Dr
- 204 Woodpecker Ln
- 8 Saint Andrews Ct
- 30 Spyglass Ct
- 28 Ridgley St
- 22 Greenbrier Dr
- 4 Brighton Ct
- 7 Foundry Blvd
- 503 Pennington Dr
- 102 Levis Dr
- 18 Foundry Blvd
- 610 Ogden Dr
- 430 W Country Club Dr
- 70 Tarnsfield Rd
- 45 Broad St
- 104 Levis Dr
- 26 Sawgrass Dr
- 48 Broad St
- 185 Rancocas Rd
Your Personal Tour Guide
Ask me questions while you tour the home.