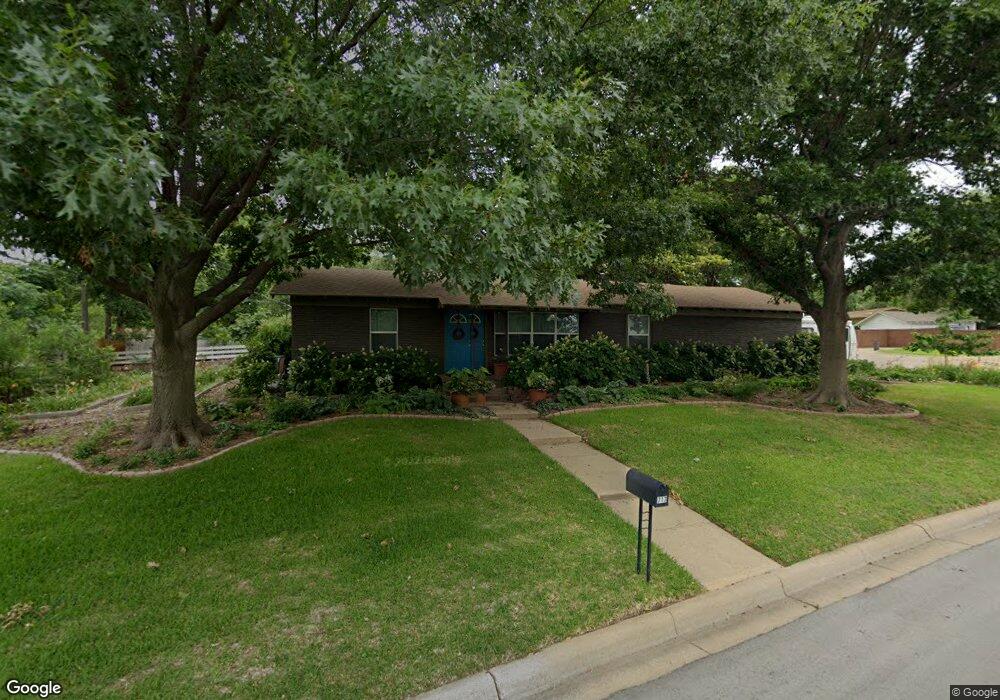
Estimated Value: $317,000 - $339,000
3
Beds
2
Baths
1,832
Sq Ft
$180/Sq Ft
Est. Value
About This Home
This home is located at 717 Hurstview Dr, Hurst, TX 76053 and is currently estimated at $330,071, approximately $180 per square foot. 717 Hurstview Dr is a home located in Tarrant County with nearby schools including West Hurst Elementary School, Hurst J High School, and L.D. Bell High School.
Ownership History
Date
Name
Owned For
Owner Type
Purchase Details
Closed on
May 1, 2015
Sold by
Marmot Llc
Bought by
Reed Tucker and Reed Rebecca
Current Estimated Value
Home Financials for this Owner
Home Financials are based on the most recent Mortgage that was taken out on this home.
Original Mortgage
$135,200
Outstanding Balance
$104,754
Interest Rate
3.84%
Mortgage Type
New Conventional
Estimated Equity
$225,317
Purchase Details
Closed on
Dec 29, 2014
Sold by
Vogel Robert and Vogel Mignon
Bought by
Residential Solutions Llc
Home Financials for this Owner
Home Financials are based on the most recent Mortgage that was taken out on this home.
Original Mortgage
$115,000
Interest Rate
4.01%
Mortgage Type
Purchase Money Mortgage
Purchase Details
Closed on
Jan 16, 2014
Sold by
Residential Solutions Llc
Bought by
Marmot Llc
Create a Home Valuation Report for This Property
The Home Valuation Report is an in-depth analysis detailing your home's value as well as a comparison with similar homes in the area
Home Values in the Area
Average Home Value in this Area
Purchase History
| Date | Buyer | Sale Price | Title Company |
|---|---|---|---|
| Reed Tucker | -- | St | |
| Residential Solutions Llc | -- | None Available | |
| Marmot Llc | -- | None Available |
Source: Public Records
Mortgage History
| Date | Status | Borrower | Loan Amount |
|---|---|---|---|
| Open | Reed Tucker | $135,200 | |
| Previous Owner | Residential Solutions Llc | $115,000 |
Source: Public Records
Tax History
| Year | Tax Paid | Tax Assessment Tax Assessment Total Assessment is a certain percentage of the fair market value that is determined by local assessors to be the total taxable value of land and additions on the property. | Land | Improvement |
|---|---|---|---|---|
| 2025 | $4,453 | $327,129 | $60,000 | $267,129 |
| 2024 | $4,453 | $327,129 | $60,000 | $267,129 |
| 2023 | $5,390 | $338,295 | $30,000 | $308,295 |
| 2022 | $4,832 | $276,890 | $30,000 | $246,890 |
| 2021 | $5,363 | $247,999 | $30,000 | $217,999 |
| 2020 | $4,863 | $202,145 | $30,000 | $172,145 |
| 2019 | $5,233 | $224,291 | $30,000 | $194,291 |
| 2018 | $4,150 | $194,360 | $18,000 | $176,360 |
| 2017 | $4,503 | $177,966 | $18,000 | $159,966 |
| 2016 | $4,174 | $164,960 | $18,000 | $146,960 |
| 2015 | -- | $97,100 | $15,000 | $82,100 |
| 2014 | -- | $97,100 | $15,000 | $82,100 |
Source: Public Records
Map
Nearby Homes
- 709 Hurstview Dr
- 712 Pine St
- 512 Shadowbrook Ln
- 756 Briarwood Ln
- 758 Briarwood Ln
- 608 W Redbud Dr
- 813 Chase Cir
- 528 Buena Vista Dr
- 231 Elm St
- 416 Simmons Dr
- 408 Simmons Dr
- 624 Forest Ln
- 209 W Cedar St
- 701 Harrison Ln
- 609 Norwood Dr
- 153 Sheri Ln
- 729 W Cheryl Ave
- 1112 Karla Dr
- 552 Norwood Dr
- 637 Post Oak Dr
Your Personal Tour Guide
Ask me questions while you tour the home.