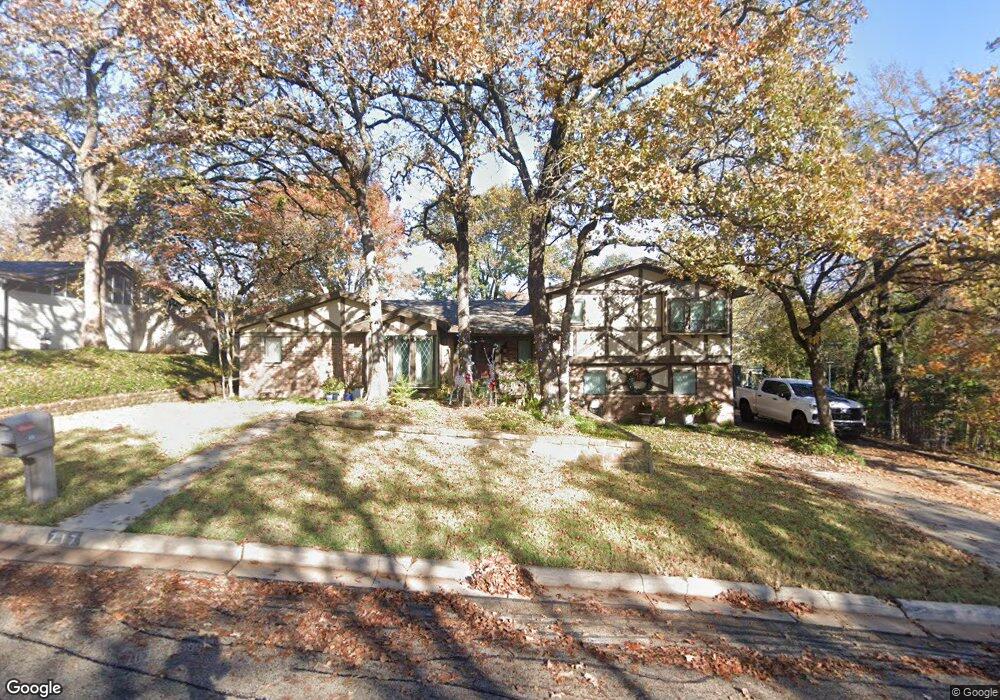
717 King Dr Bedford, TX 76022
Estimated Value: $331,000 - $412,000
3
Beds
3
Baths
1,845
Sq Ft
$196/Sq Ft
Est. Value
About This Home
This home is located at 717 King Dr, Bedford, TX 76022 and is currently estimated at $362,491, approximately $196 per square foot. 717 King Dr is a home located in Tarrant County with nearby schools including Stonegate Elementary School, Central J High School, and L.D. Bell High School.
Ownership History
Date
Name
Owned For
Owner Type
Purchase Details
Closed on
Oct 26, 2025
Sold by
Worley Jeff M and Worley Edith Kellogg
Bought by
Worley Living Trust and Worley
Current Estimated Value
Purchase Details
Closed on
Aug 23, 1999
Sold by
Ellis Terry A and Ellis Terry R
Bought by
Worley Jeff M and Worley Kelly
Home Financials for this Owner
Home Financials are based on the most recent Mortgage that was taken out on this home.
Original Mortgage
$112,100
Interest Rate
7.65%
Purchase Details
Closed on
Jul 29, 1996
Sold by
Cook Carlton R and Cook Dorothy A
Bought by
Ellis Terry A
Home Financials for this Owner
Home Financials are based on the most recent Mortgage that was taken out on this home.
Original Mortgage
$95,494
Interest Rate
8.33%
Create a Home Valuation Report for This Property
The Home Valuation Report is an in-depth analysis detailing your home's value as well as a comparison with similar homes in the area
Home Values in the Area
Average Home Value in this Area
Purchase History
| Date | Buyer | Sale Price | Title Company |
|---|---|---|---|
| Worley Living Trust | -- | None Listed On Document | |
| Worley Jeff M | -- | First American Title Co | |
| Ellis Terry A | -- | First American Title Co |
Source: Public Records
Mortgage History
| Date | Status | Borrower | Loan Amount |
|---|---|---|---|
| Previous Owner | Worley Jeff M | $112,100 | |
| Previous Owner | Ellis Terry A | $95,494 |
Source: Public Records
Tax History Compared to Growth
Tax History
| Year | Tax Paid | Tax Assessment Tax Assessment Total Assessment is a certain percentage of the fair market value that is determined by local assessors to be the total taxable value of land and additions on the property. | Land | Improvement |
|---|---|---|---|---|
| 2025 | $3,491 | $223,000 | $75,000 | $148,000 |
| 2024 | $3,491 | $241,000 | $75,000 | $166,000 |
| 2023 | $4,799 | $256,717 | $55,000 | $201,717 |
| 2022 | $4,968 | $229,831 | $55,000 | $174,831 |
| 2021 | $4,871 | $206,797 | $55,000 | $151,797 |
| 2020 | $5,103 | $214,625 | $55,000 | $159,625 |
| 2019 | $5,063 | $214,625 | $55,000 | $159,625 |
| 2018 | $4,221 | $189,456 | $30,000 | $159,456 |
| 2017 | $4,416 | $201,192 | $30,000 | $171,192 |
| 2016 | $4,015 | $171,000 | $30,000 | $141,000 |
| 2015 | $3,514 | $150,871 | $20,000 | $130,871 |
| 2014 | $3,514 | $163,000 | $20,000 | $143,000 |
Source: Public Records
Map
Nearby Homes
- 1108 Wade Dr
- 1204 Edgecliff Dr
- 921 Overhill Dr
- 1004 Overhill Dr
- 933 Wade Dr
- 909 Overhill Dr
- 604 Donna Ln
- 1213 Briar Dr
- 501 Merrill Dr
- 1031 Boston Blvd
- 832 Chateau Valee Cir
- 1008 Russell Ln
- 904 Nelson Terrace
- 849 Russell Ln
- 1236 King Dr
- 344 Bedford Ct E
- 49 Coffee Tavern Rd
- 341 Hurst Dr
- 1509 Shirley Way
- 1112 Ann St