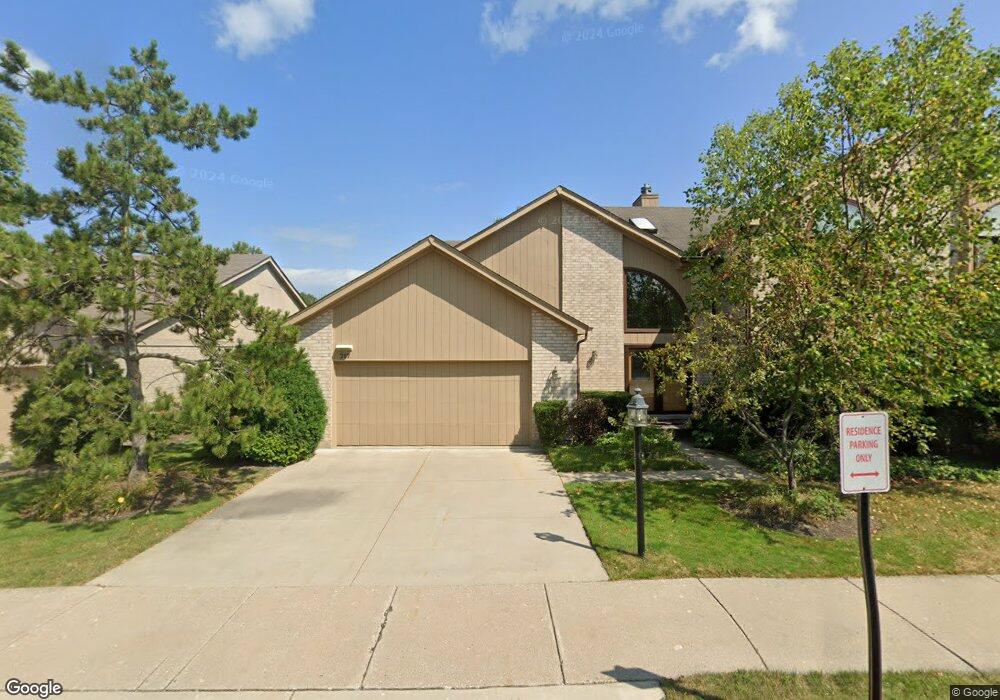
717 Laburnum Dr Northbrook, IL 60062
Estimated Value: $475,000 - $870,000
3
Beds
3
Baths
2,984
Sq Ft
$221/Sq Ft
Est. Value
About This Home
This home is located at 717 Laburnum Dr, Northbrook, IL 60062 and is currently estimated at $660,236, approximately $221 per square foot. 717 Laburnum Dr is a home located in Cook County with nearby schools including Hickory Point Elementary School, Shabonee Elementary School, and Wood Oaks Jr High School.
Ownership History
Date
Name
Owned For
Owner Type
Purchase Details
Closed on
May 25, 2001
Sold by
Ferreira Gilberto and Ferreira Beatriz E
Bought by
Rubanovich Andrew and Rubanovich Sofia
Current Estimated Value
Home Financials for this Owner
Home Financials are based on the most recent Mortgage that was taken out on this home.
Original Mortgage
$250,000
Outstanding Balance
$91,413
Interest Rate
6.75%
Estimated Equity
$568,823
Purchase Details
Closed on
Mar 28, 1997
Sold by
Ferreira Gilberto and Ferreira Beatriz Ee
Bought by
Ferreira Gilberto and Ferreira Beatriz E
Purchase Details
Closed on
Nov 24, 1993
Sold by
First American Bank
Bought by
Ferreira Gilberto and Ferreira Beatriz E
Home Financials for this Owner
Home Financials are based on the most recent Mortgage that was taken out on this home.
Original Mortgage
$240,000
Interest Rate
6.82%
Create a Home Valuation Report for This Property
The Home Valuation Report is an in-depth analysis detailing your home's value as well as a comparison with similar homes in the area
Home Values in the Area
Average Home Value in this Area
Purchase History
| Date | Buyer | Sale Price | Title Company |
|---|---|---|---|
| Rubanovich Andrew | $475,000 | Centennial Title Incorporate | |
| Ferreira Gilberto | -- | -- | |
| Ferreira Gilberto | $230,000 | -- |
Source: Public Records
Mortgage History
| Date | Status | Borrower | Loan Amount |
|---|---|---|---|
| Open | Rubanovich Andrew | $250,000 | |
| Previous Owner | Ferreira Gilberto | $240,000 |
Source: Public Records
Tax History Compared to Growth
Tax History
| Year | Tax Paid | Tax Assessment Tax Assessment Total Assessment is a certain percentage of the fair market value that is determined by local assessors to be the total taxable value of land and additions on the property. | Land | Improvement |
|---|---|---|---|---|
| 2024 | $11,204 | $54,001 | $8,998 | $45,003 |
| 2023 | $10,779 | $54,001 | $8,998 | $45,003 |
| 2022 | $10,779 | $54,001 | $8,998 | $45,003 |
| 2021 | $8,851 | $40,958 | $4,447 | $36,511 |
| 2020 | $8,822 | $40,958 | $4,447 | $36,511 |
| 2019 | $9,213 | $45,009 | $4,447 | $40,562 |
| 2018 | $10,474 | $46,892 | $3,891 | $43,001 |
| 2017 | $10,194 | $46,892 | $3,891 | $43,001 |
| 2016 | $9,753 | $46,892 | $3,891 | $43,001 |
| 2015 | $9,581 | $41,874 | $3,150 | $38,724 |
| 2014 | $9,362 | $41,874 | $3,150 | $38,724 |
| 2013 | $9,084 | $41,874 | $3,150 | $38,724 |
Source: Public Records
Map
Nearby Homes
- 3549 Bayberry Dr
- 455 Laburnum Dr
- 3850 Dauphine Ave
- 440 Huehl Rd
- 47 The Court of Greenway Unit 121
- 639 Touraine Terrace
- 4050 Dundee Rd Unit 205K
- 4050 Dundee Rd Unit 203K
- 4003 Yorkshire Ln
- 3 The Court of Harborside Unit 111
- 3110 Pheasant Creek Dr Unit 206
- 3110 Pheasant Creek Dr Unit 101
- 3050 Pheasant Creek Dr Unit 301
- 1012 Sussex Dr Unit 1012
- 12 The Court of Island Point
- 3030 Pheasant Creek Dr Unit 102
- 3030 Pheasant Creek Dr Unit 207
- 717 Sarah Ln
- 1039 Sussex Dr Unit 1039
- 8 The Court of Charlwood
- 729 Laburnum Dr
- 705 Laburnum Dr
- 3514 Laburnum Ct
- 3560 Laburnum Ct
- 3558 Laburnum Ct
- 3502 Laburnum Ct
- 3546 Laburnum Ct
- 638 Dauphine Ct
- 664 Laburnum Dr
- 3525 Laburnum Ct
- 632 Dauphine Ct
- 3559 Laburnum Ct
- 3555 Laburnum Ct
- 3501 Laburnum Ct
- 3547 Laburnum Ct
- 637 Dauphine Ct
- 3515 Laburnum Ct
- 3519 Laburnum Ct
- 3543 Laburnum Ct
- 3523 Laburnum Ct