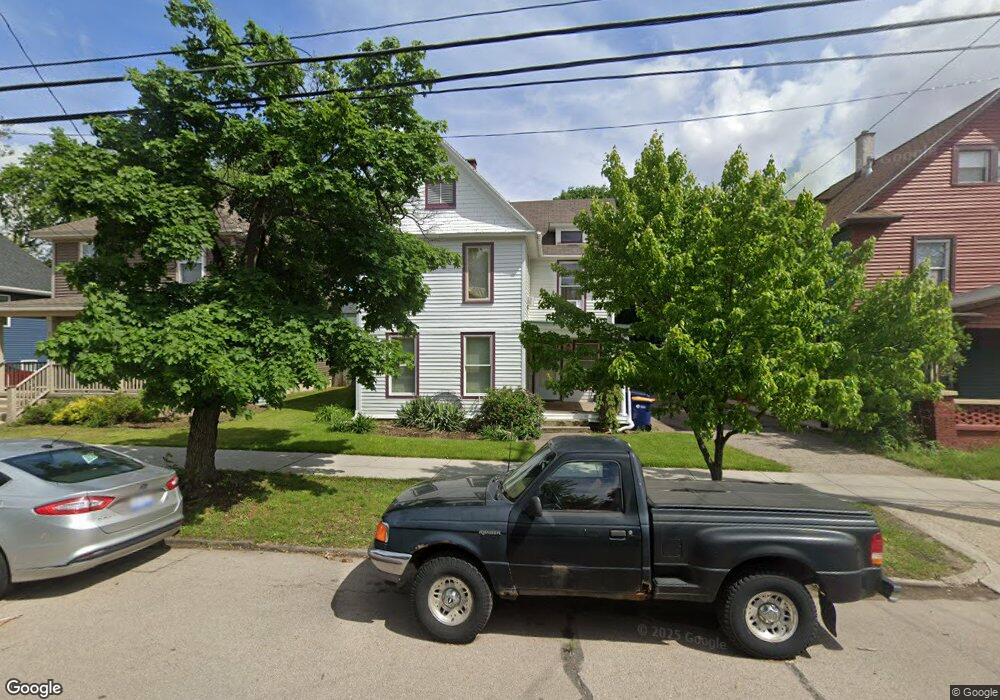
717 Logan St SE Grand Rapids, MI 49503
Madison Area NeighborhoodEstimated Value: $189,000 - $314,000
--
Bed
--
Bath
1,889
Sq Ft
$129/Sq Ft
Est. Value
About This Home
This home is located at 717 Logan St SE, Grand Rapids, MI 49503 and is currently estimated at $242,862, approximately $128 per square foot. 717 Logan St SE is a home located in Kent County with nearby schools including Martin Luther King Leadership Academy, Alger Middle School, and Ottawa Hills High School.
Ownership History
Date
Name
Owned For
Owner Type
Purchase Details
Closed on
Mar 13, 2012
Sold by
The Richard Delano Family Trust
Bought by
Vasquez Matias
Current Estimated Value
Purchase Details
Closed on
Oct 28, 2003
Sold by
The Richard Delano Family Trust
Bought by
Vazquez Matias
Purchase Details
Closed on
Oct 3, 2003
Sold by
Hamersma Brian and Hamersma Norvy
Bought by
The Richard Delano Family Trust
Purchase Details
Closed on
Jul 19, 2000
Purchase Details
Closed on
Aug 1, 1991
Sold by
Blake Inv Grp and Delano Blake
Bought by
Vazquez Matias
Purchase Details
Closed on
Jul 3, 1991
Sold by
Longsdrf Longsdrf E E and Longsdrf Delano R
Bought by
Vazquez Matias
Purchase Details
Closed on
Feb 1, 1986
Purchase Details
Closed on
Mar 17, 1984
Purchase Details
Closed on
Jul 21, 1981
Purchase Details
Closed on
Dec 4, 1980
Purchase Details
Closed on
Jan 29, 1980
Create a Home Valuation Report for This Property
The Home Valuation Report is an in-depth analysis detailing your home's value as well as a comparison with similar homes in the area
Home Values in the Area
Average Home Value in this Area
Purchase History
| Date | Buyer | Sale Price | Title Company |
|---|---|---|---|
| Vasquez Matias | $50,000 | First American Title Ins Co | |
| Vazquez Matias | -- | Metropolitan Title Company | |
| Vazquez Matias | -- | Metropolitan Title Company | |
| The Richard Delano Family Trust | -- | Metropolitan Title Company | |
| The Richard Delano Family Trust | -- | Metropolitan Title Company | |
| -- | -- | -- | |
| Vazquez Matias | -- | -- | |
| Vazquez Matias | -- | -- | |
| -- | $18,000 | -- | |
| -- | $2,000 | -- | |
| -- | $8,000 | -- | |
| -- | $2,000 | -- | |
| -- | $2,000 | -- |
Source: Public Records
Tax History Compared to Growth
Tax History
| Year | Tax Paid | Tax Assessment Tax Assessment Total Assessment is a certain percentage of the fair market value that is determined by local assessors to be the total taxable value of land and additions on the property. | Land | Improvement |
|---|---|---|---|---|
| 2025 | $1,258 | $99,000 | $0 | $0 |
| 2024 | $1,258 | $89,300 | $0 | $0 |
| 2023 | $1,316 | $78,500 | $0 | $0 |
| 2022 | $1,251 | $65,400 | $0 | $0 |
| 2021 | $1,220 | $58,900 | $0 | $0 |
| 2020 | $1,174 | $50,000 | $0 | $0 |
| 2019 | $1,213 | $41,100 | $0 | $0 |
| 2018 | $1,174 | $34,300 | $0 | $0 |
| 2017 | $1,145 | $29,000 | $0 | $0 |
| 2016 | $1,153 | $25,900 | $0 | $0 |
| 2015 | $1,089 | $25,900 | $0 | $0 |
| 2013 | -- | $26,500 | $0 | $0 |
Source: Public Records
Map
Nearby Homes
- 743 Logan St SE
- 427 James Ave SE
- 321 Henry Ave SE
- 272 Henry Ave SE
- 811 Fairmount St SE
- 941 Wealthy St SE
- 509 Diamond Ave SE
- 700 Union Ave SE
- 1000 Logan St SE
- 835 Bates St SE
- 318 Diamond Ave SE
- 623 Cherry St SE
- 1036 Logan St SE
- 505 Cherry St SE Unit 301
- 233 Morris Ave SE
- 415 Prospect Ave SE
- 643 Madison Ave SE
- 747 Prince St SE
- 853 Geneva Ave SE
- 436 Martin Luther King Junior St SE
- 711 Logan St SE
- 721 Logan St SE
- 445 Charles Ave SE
- 453 Charles Ave SE
- 709 Logan St SE
- 442 Henry Ave SE
- 441 Charles Ave SE
- 444 Henry Ave SE
- 450 Henry Ave SE
- 448 Henry Ave SE
- 701 Logan St SE
- 440 Henry Ave SE
- 437 Charles Ave SE
- 446 Henry Ave SE
- 448 Charles Ave SE
- 708 Logan St SE
- 710 Logan St SE
- 716 Logan St SE
- 722 Logan St SE
- 433 Charles Ave SE