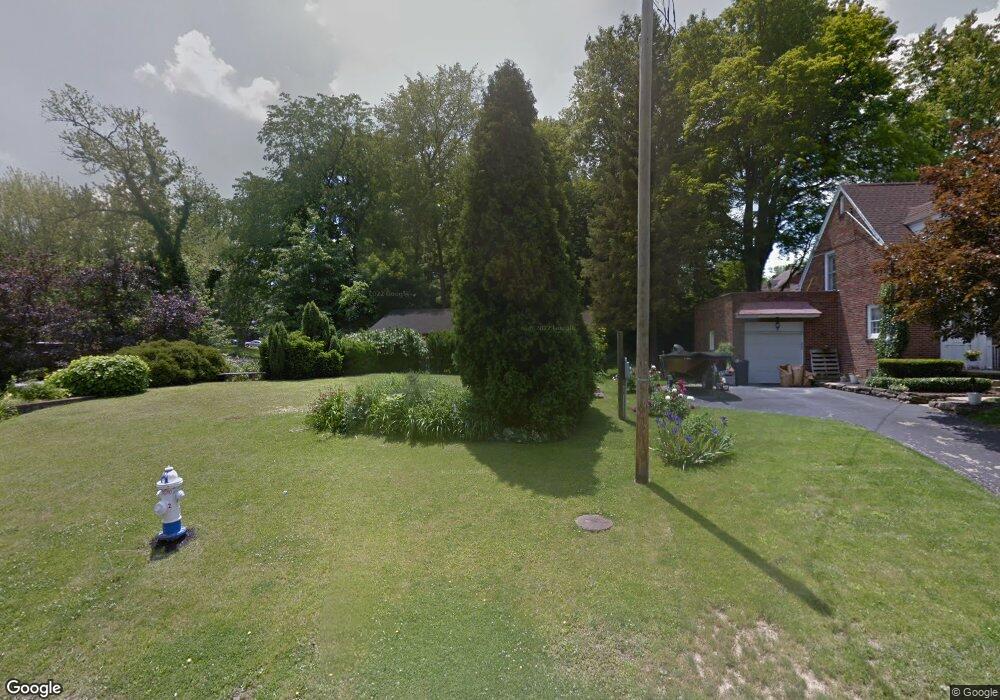
717 Maple St Mansfield, OH 44906
Estimated Value: $151,000 - $180,000
2
Beds
2
Baths
1,637
Sq Ft
$101/Sq Ft
Est. Value
About This Home
This home is located at 717 Maple St, Mansfield, OH 44906 and is currently estimated at $165,019, approximately $100 per square foot. 717 Maple St is a home located in Richland County with nearby schools including Goal Digital Academy, Discovery School, and St. Peter's Junior High / High School.
Ownership History
Date
Name
Owned For
Owner Type
Purchase Details
Closed on
Aug 8, 2016
Sold by
Flieger Benjamin K and Flieger Shelly A
Bought by
Flieger Benjamin K and Flieger Shelly A
Current Estimated Value
Purchase Details
Closed on
Jan 22, 2002
Sold by
Houk Edward
Bought by
Flieger Benjamin K
Home Financials for this Owner
Home Financials are based on the most recent Mortgage that was taken out on this home.
Original Mortgage
$74,500
Outstanding Balance
$30,184
Interest Rate
6.92%
Mortgage Type
New Conventional
Estimated Equity
$134,835
Purchase Details
Closed on
Dec 20, 1999
Sold by
Brumm Philip E
Bought by
Houck Edward
Purchase Details
Closed on
Jun 15, 1995
Sold by
Benson Maurice L
Bought by
Brumm Philip E
Home Financials for this Owner
Home Financials are based on the most recent Mortgage that was taken out on this home.
Original Mortgage
$48,750
Interest Rate
7.63%
Mortgage Type
New Conventional
Purchase Details
Closed on
Mar 11, 1991
Sold by
Schneider George Stanford
Bought by
Benson Maurice L
Create a Home Valuation Report for This Property
The Home Valuation Report is an in-depth analysis detailing your home's value as well as a comparison with similar homes in the area
Home Values in the Area
Average Home Value in this Area
Purchase History
| Date | Buyer | Sale Price | Title Company |
|---|---|---|---|
| Flieger Benjamin K | -- | None Available | |
| Flieger Benjamin K | $87,700 | -- | |
| Houck Edward | $72,000 | -- | |
| Brumm Philip E | $65,000 | -- | |
| Benson Maurice L | $41,500 | -- |
Source: Public Records
Mortgage History
| Date | Status | Borrower | Loan Amount |
|---|---|---|---|
| Open | Flieger Benjamin K | $74,500 | |
| Previous Owner | Brumm Philip E | $48,750 |
Source: Public Records
Tax History
| Year | Tax Paid | Tax Assessment Tax Assessment Total Assessment is a certain percentage of the fair market value that is determined by local assessors to be the total taxable value of land and additions on the property. | Land | Improvement |
|---|---|---|---|---|
| 2024 | $1,520 | $33,200 | $6,480 | $26,720 |
| 2023 | $1,555 | $33,200 | $6,480 | $26,720 |
| 2022 | $1,445 | $25,870 | $5,560 | $20,310 |
| 2021 | $1,455 | $25,870 | $5,560 | $20,310 |
| 2020 | $1,488 | $25,870 | $5,560 | $20,310 |
| 2019 | $1,649 | $25,870 | $5,560 | $20,310 |
| 2018 | $1,627 | $25,870 | $5,560 | $20,310 |
| 2017 | $1,561 | $25,870 | $5,560 | $20,310 |
| 2016 | $1,539 | $24,380 | $7,210 | $17,170 |
| 2015 | $1,470 | $24,380 | $7,210 | $17,170 |
| 2014 | $1,451 | $24,380 | $7,210 | $17,170 |
| 2012 | $552 | $24,370 | $7,580 | $16,790 |
Source: Public Records
Map
Nearby Homes
- 143 Fairlawn Ave
- 135 Fairlawn Ave
- 129 Fairlawn Ave
- 169 Euclid Ave
- 679 Coleman Rd
- 189 Westwood Ave
- 116 Stewart Ave S
- 686 Barnard Ave
- 108 Stewart Ave S
- 31 Parkwood Blvd
- 190 Dawson Ave
- 126 Dawson Ave
- 71 Dawson Ave
- 455 Marion Ave
- 356 S Linden Rd
- 988 Kentland Dr
- 616 Cline Ave
- 519 Heineman Blvd
- 30 Douglas Ave
- 38 Penn Ave
- 725 Maple St
- 180 Mapledale Ave
- 707 Maple St
- 179 Taylor Rd
- 190 Mapledale Ave
- 185 Taylor Rd
- 181 Mapledale Ave
- 693 Maple St
- 191 Taylor Rd
- 193 Mapledale Ave
- 166 Taylor Rd Unit 168
- 195 Taylor Rd
- 196 Mapledale Ave
- 689 Maple St
- 199 Taylor Rd
- 180 Taylor Rd
- 206 Mapledale Ave
- 683 Maple St
- 184 Taylor Rd
- 195 Mapledale Ave
Your Personal Tour Guide
Ask me questions while you tour the home.