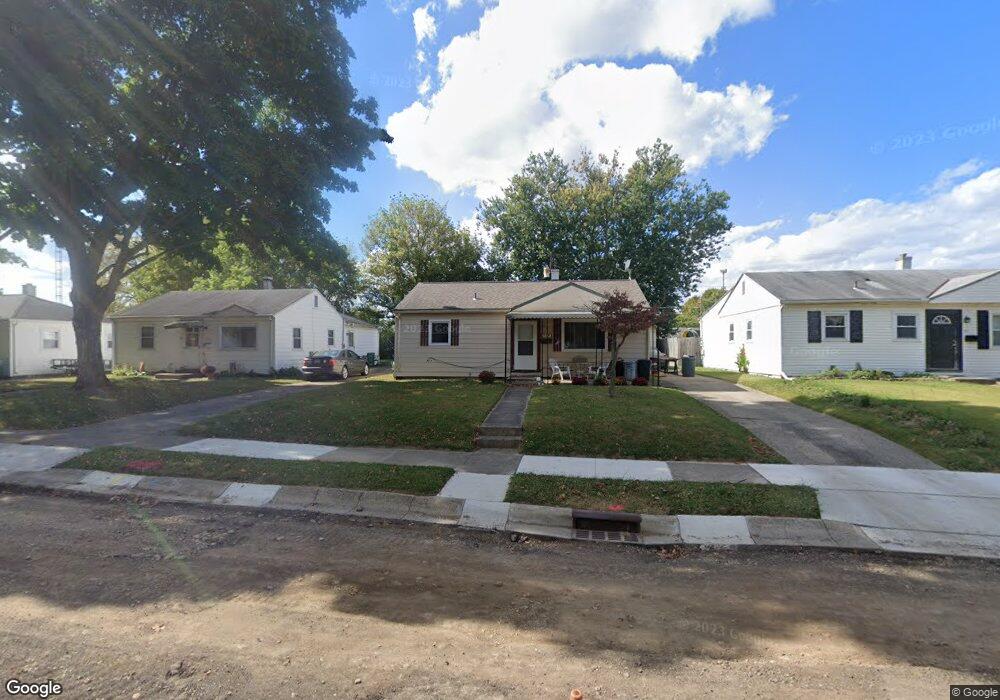
717 Mavor St Springfield, OH 45505
Estimated Value: $110,000 - $134,000
2
Beds
1
Bath
816
Sq Ft
$152/Sq Ft
Est. Value
About This Home
This home is located at 717 Mavor St, Springfield, OH 45505 and is currently estimated at $123,902, approximately $151 per square foot. 717 Mavor St is a home located in Clark County with nearby schools including Mann Elementary School, Schaefer Middle School, and Springfield High School.
Ownership History
Date
Name
Owned For
Owner Type
Purchase Details
Closed on
Feb 24, 2024
Sold by
Detrick James Allen
Bought by
Detrick Leasing Llc
Current Estimated Value
Purchase Details
Closed on
Feb 27, 2015
Sold by
Fannie Mae
Bought by
Detrick Michael J and Detrick Carol L
Purchase Details
Closed on
Dec 12, 2014
Sold by
Ratliff Corey L
Bought by
Federal National Mortgage Association and Fannie Mae
Purchase Details
Closed on
May 24, 2002
Sold by
Fogle Paul F and Fogle Haley S
Bought by
Ratliff Corey L
Home Financials for this Owner
Home Financials are based on the most recent Mortgage that was taken out on this home.
Original Mortgage
$68,918
Interest Rate
7%
Mortgage Type
FHA
Purchase Details
Closed on
Sep 13, 1995
Sold by
Shrf Scott A Desantis Pr
Bought by
Federal National Mortgage Association
Create a Home Valuation Report for This Property
The Home Valuation Report is an in-depth analysis detailing your home's value as well as a comparison with similar homes in the area
Home Values in the Area
Average Home Value in this Area
Purchase History
| Date | Buyer | Sale Price | Title Company |
|---|---|---|---|
| Detrick Leasing Llc | -- | None Listed On Document | |
| Detrick Leasing Llc | -- | None Listed On Document | |
| Detrick Michael J | -- | Omega Title Agency Llc | |
| Federal National Mortgage Association | $30,000 | Attorney | |
| Ratliff Corey L | $70,000 | -- | |
| Federal National Mortgage Association | $36,000 | -- |
Source: Public Records
Mortgage History
| Date | Status | Borrower | Loan Amount |
|---|---|---|---|
| Previous Owner | Ratliff Corey L | $68,918 |
Source: Public Records
Tax History Compared to Growth
Tax History
| Year | Tax Paid | Tax Assessment Tax Assessment Total Assessment is a certain percentage of the fair market value that is determined by local assessors to be the total taxable value of land and additions on the property. | Land | Improvement |
|---|---|---|---|---|
| 2024 | $1,214 | $24,580 | $4,590 | $19,990 |
| 2023 | $1,214 | $24,580 | $4,590 | $19,990 |
| 2022 | $1,244 | $24,580 | $4,590 | $19,990 |
| 2021 | $1,048 | $19,070 | $3,150 | $15,920 |
| 2020 | $1,050 | $19,070 | $3,150 | $15,920 |
| 2019 | $1,053 | $19,070 | $3,150 | $15,920 |
| 2018 | $1,030 | $17,910 | $2,630 | $15,280 |
| 2017 | $1,029 | $17,763 | $2,625 | $15,138 |
| 2016 | $1,031 | $17,763 | $2,625 | $15,138 |
| 2015 | $1,749 | $17,252 | $2,625 | $14,627 |
| 2014 | $1,123 | $17,252 | $2,625 | $14,627 |
| 2013 | $1,111 | $17,252 | $2,625 | $14,627 |
Source: Public Records
Map
Nearby Homes
- 2751 Share St
- 2753 Van Buren Ave
- 2733 Elmore Dr
- 528 Geron Dr
- 438 Lawnview Ave
- 3158 Meadow Wood Dr
- 3154 Sherwood Park Dr
- 3012 E High St
- 184 Willis Ave
- 2434 Irwin Ave
- 360 Buxton Ave
- 2422 Lexington Ave
- 327 Buxton Ave
- 2345 Irwin Ave
- 120 S Fostoria Ave
- 2702 Maplewood Ave
- 637 S Arlington Ave
- 351 S Clairmont Ave
- 501 Elbron Rd
- 258 Forest Dr