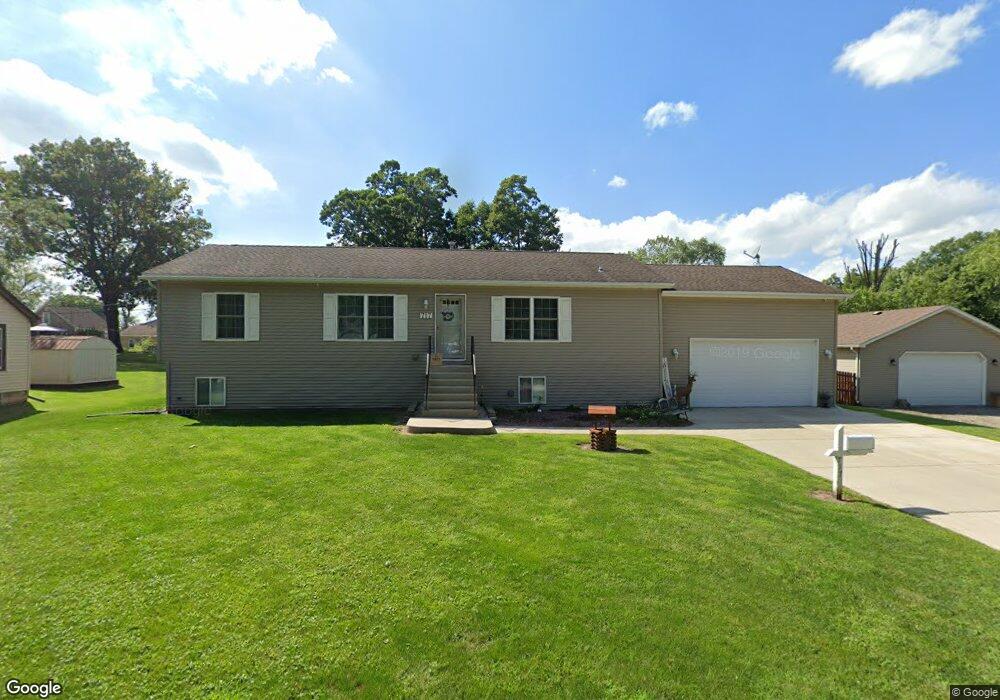
717 Mohawk St Joliet, IL 60432
Belmont NeighborhoodEstimated Value: $196,000 - $269,000
Studio
--
Bath
1,352
Sq Ft
$165/Sq Ft
Est. Value
About This Home
This home is located at 717 Mohawk St, Joliet, IL 60432 and is currently estimated at $223,433, approximately $165 per square foot. 717 Mohawk St is a home located in Will County with nearby schools including Isaac Singleton Elementary School, Gompers Junior High School, and Joliet Central High School.
Ownership History
Date
Name
Owned For
Owner Type
Purchase Details
Closed on
Jan 29, 2016
Sold by
Bledsoe Melissa M and Soland Bryan M
Bought by
Mitchell Kevin
Current Estimated Value
Home Financials for this Owner
Home Financials are based on the most recent Mortgage that was taken out on this home.
Original Mortgage
$133,000
Outstanding Balance
$107,446
Interest Rate
4.37%
Mortgage Type
New Conventional
Estimated Equity
$115,987
Purchase Details
Closed on
Oct 24, 2005
Sold by
Bledsoe Paul A and Bledsoe Wilma J
Bought by
Bledsoe Melissa M and Soland Bryan M
Purchase Details
Closed on
May 15, 2001
Sold by
Minnick Glenn A
Bought by
Bledsoe Paul A and Bledsoe Wilma J
Create a Home Valuation Report for This Property
The Home Valuation Report is an in-depth analysis detailing your home's value as well as a comparison with similar homes in the area
Home Values in the Area
Average Home Value in this Area
Purchase History
| Date | Buyer | Sale Price | Title Company |
|---|---|---|---|
| Mitchell Kevin | $140,000 | Ct | |
| Bledsoe Melissa M | -- | -- | |
| Bledsoe Paul A | $11,000 | Chicago Title Insurance Co |
Source: Public Records
Mortgage History
| Date | Status | Borrower | Loan Amount |
|---|---|---|---|
| Open | Mitchell Kevin | $133,000 |
Source: Public Records
Tax History
| Year | Tax Paid | Tax Assessment Tax Assessment Total Assessment is a certain percentage of the fair market value that is determined by local assessors to be the total taxable value of land and additions on the property. | Land | Improvement |
|---|---|---|---|---|
| 2024 | $5,316 | $71,467 | $4,247 | $67,220 |
| 2023 | $5,316 | $63,498 | $3,773 | $59,725 |
| 2022 | $4,750 | $57,438 | $3,413 | $54,025 |
| 2021 | $4,478 | $53,646 | $3,188 | $50,458 |
| 2020 | $4,220 | $50,946 | $3,028 | $47,918 |
| 2019 | $3,973 | $47,347 | $2,814 | $44,533 |
| 2018 | $3,631 | $42,437 | $2,500 | $39,937 |
| 2017 | $3,404 | $38,583 | $2,273 | $36,310 |
| 2016 | $3,211 | $35,515 | $2,080 | $33,435 |
| 2015 | $3,022 | $33,300 | $1,950 | $31,350 |
| 2014 | $3,022 | $33,150 | $1,950 | $31,200 |
| 2013 | $3,022 | $36,402 | $2,162 | $34,240 |
Source: Public Records
Map
Nearby Homes
- 1607 Maple Rd
- 824 Hague St
- 1205 Gage Ct
- 1208 Hague St
- 411 Leach Ave
- 2216 Beechwood Rd
- 1019 Magnolia Ave
- 1106 Magnolia Ave
- 8 Peale St
- 2417 Fleetwood Dr
- 1111 Colonial Dr Unit 1
- 1110 Colonial Dr Unit 1
- Vacant Woodruff Rd
- 1124 Colonial Dr Unit 1
- 16 Anderson Ave
- 725 Chase Ave
- 661 Abe St
- 1818 E Washington St
- 931 Saddle Ridge Dr
- 933 Saddle Ridge Dr
- 712 Algonquin St
- 707 Mohawk St
- 707 Mohawk St
- 716 Algonquin St
- 712 Mohawk St
- 712 Mohawk St
- 710 Algonquin St
- 710 Algonquin St
- 718 Mohawk St
- 710 Mohawk St
- 708 Algonquin St
- 1623 Cleveland Ave
- 715 Mohawk St
- 706 Algonquin St
- 701 Mohawk St
- 701 Mohawk St
- 708 Mohawk St
- 715 Cayuga St
- 713 Cayuga St
- 719 Cayuga St
Your Personal Tour Guide
Ask me questions while you tour the home.