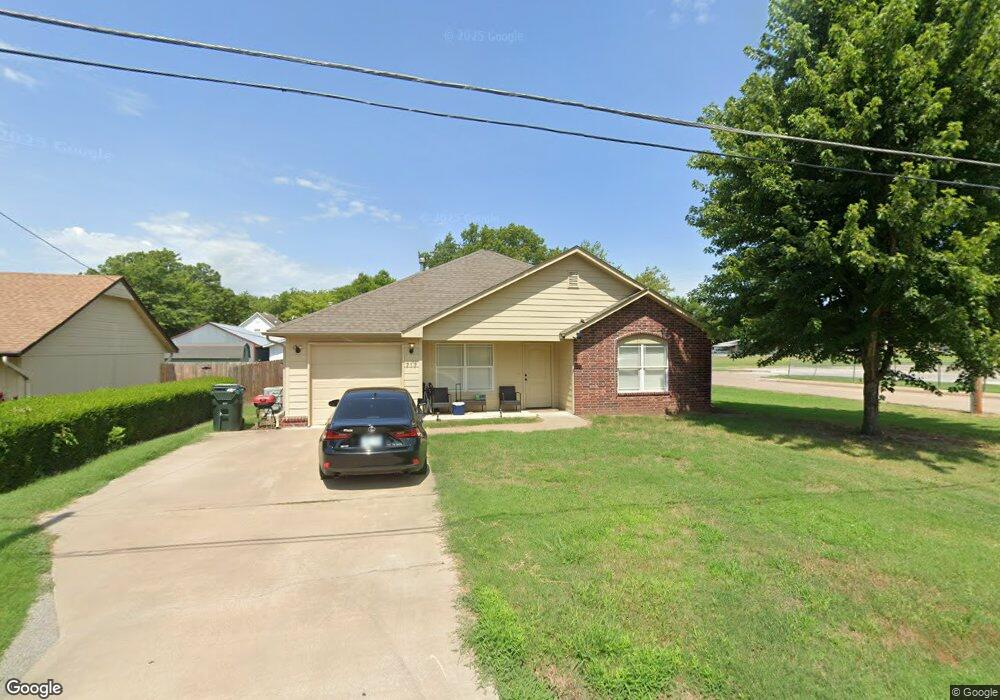
717 N Weenonah Ave Claremore, OK 74017
Estimated Value: $153,000 - $155,956
2
Beds
2
Baths
945
Sq Ft
$163/Sq Ft
Est. Value
About This Home
This home is located at 717 N Weenonah Ave, Claremore, OK 74017 and is currently estimated at $154,489, approximately $163 per square foot. 717 N Weenonah Ave is a home located in Rogers County with nearby schools including Claremont Elementary School, Will Rogers Junior High School, and Claremore High School.
Ownership History
Date
Name
Owned For
Owner Type
Purchase Details
Closed on
Jul 31, 2008
Sold by
Robinson Rodney Michael and Robinson Caroline Suzane
Bought by
Green Investment Company Llc
Current Estimated Value
Home Financials for this Owner
Home Financials are based on the most recent Mortgage that was taken out on this home.
Original Mortgage
$20,000
Interest Rate
6.38%
Mortgage Type
Purchase Money Mortgage
Purchase Details
Closed on
Jul 10, 2006
Sold by
John Hinson Rentals Inc
Bought by
Hinson John O and Hinson Judith K
Home Financials for this Owner
Home Financials are based on the most recent Mortgage that was taken out on this home.
Original Mortgage
$48,000
Interest Rate
6.63%
Mortgage Type
New Conventional
Purchase Details
Closed on
Oct 18, 2000
Sold by
Rcb Bank
Purchase Details
Closed on
Jul 6, 2000
Sold by
Sorensen Douglas
Purchase Details
Closed on
Jul 2, 1993
Sold by
Merriott Kathy J
Create a Home Valuation Report for This Property
The Home Valuation Report is an in-depth analysis detailing your home's value as well as a comparison with similar homes in the area
Home Values in the Area
Average Home Value in this Area
Purchase History
| Date | Buyer | Sale Price | Title Company |
|---|---|---|---|
| Green Investment Company Llc | $20,000 | None Available | |
| Hinson John O | -- | None Available | |
| -- | $14,000 | -- | |
| -- | -- | -- | |
| -- | $28,000 | -- |
Source: Public Records
Mortgage History
| Date | Status | Borrower | Loan Amount |
|---|---|---|---|
| Closed | Green Investment Company Llc | $20,000 | |
| Previous Owner | Hinson John O | $48,000 |
Source: Public Records
Tax History Compared to Growth
Tax History
| Year | Tax Paid | Tax Assessment Tax Assessment Total Assessment is a certain percentage of the fair market value that is determined by local assessors to be the total taxable value of land and additions on the property. | Land | Improvement |
|---|---|---|---|---|
| 2025 | $1,140 | $12,953 | $2,503 | $10,450 |
| 2024 | $1,140 | $12,336 | $2,384 | $9,952 |
| 2023 | $1,140 | $11,749 | $2,244 | $9,505 |
| 2022 | $1,036 | $11,190 | $2,063 | $9,127 |
| 2021 | $941 | $10,657 | $2,063 | $8,594 |
| 2020 | $930 | $10,172 | $1,650 | $8,522 |
| 2019 | $896 | $9,673 | $1,650 | $8,023 |
| 2018 | $917 | $9,928 | $1,650 | $8,278 |
| 2017 | $904 | $9,847 | $1,650 | $8,197 |
| 2016 | $901 | $9,599 | $1,650 | $7,949 |
| 2015 | $874 | $9,428 | $1,650 | $7,778 |
| 2014 | $872 | $9,409 | $1,650 | $7,759 |
Source: Public Records
Map
Nearby Homes
- 617 N Chickasaw Ave
- 119 N Missouri Ave
- 104 W 7th St
- 401 W Blue Starr Dr
- 0 N J M Davis Blvd
- 202 W 4th St
- 419 E 12th St
- 305 E Falletti Ave
- 809 W 9th St
- 1335 N Mcfarland Place
- 1100 N Oseuma Ave Unit C
- 317 E 4th St
- 321 E 4th St
- 902 W 8th St
- 428 E 4th St
- 1411 N Choctaw Place
- 1012 N Osage Ave
- 417 E Will Rogers Blvd
- 402 E Patti Page Blvd
- 321 E Patti Page Blvd
- 201 W 10th St
- 715 N Weenonah Ave
- 205 W 10th St
- 718 N Weenonah Ave
- 714 N Weenonah Ave
- 718 N Muskogee Ave
- 220 W 9th St
- 202 W 9th St
- 115 W 10th St
- 110 W 9th St
- 222 W 9th St
- 713 N Chickasaw Ave
- 715 N Chickasaw Ave
- 103 W 10th St
- 719 N Muskogee Ave
- 801 N Muskogee Ave
- 717 N Muskogee Ave
- 705 N Muskogee Ave
- 805 N Muskogee Ave
- 620 N Muskogee Ave