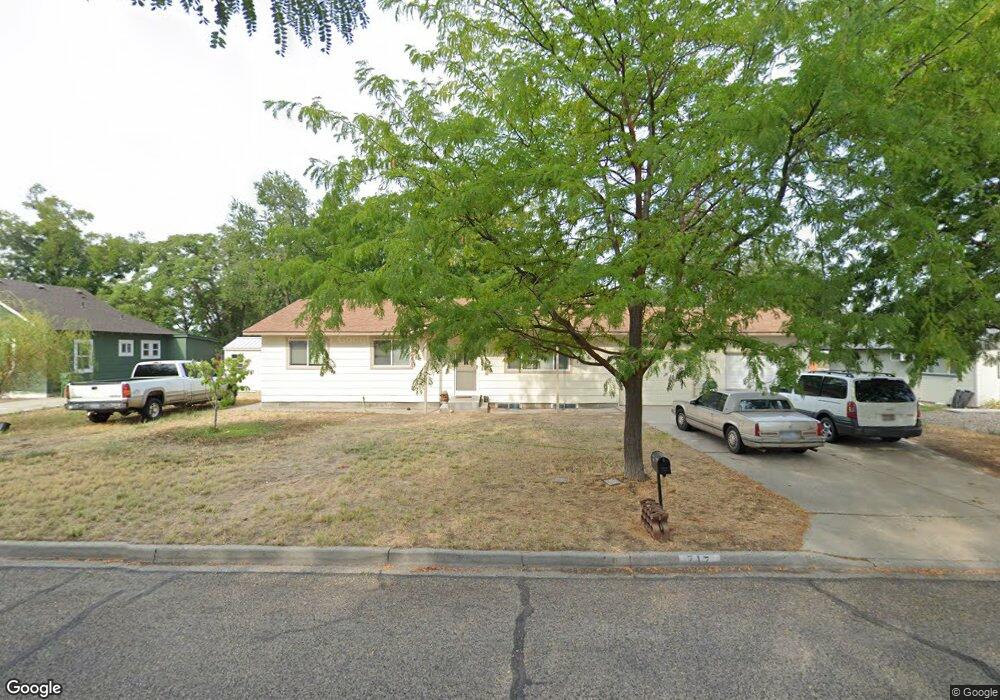
717 NW 3rd St Ontario, ID 97914
Estimated Value: $289,000 - $311,079
3
Beds
2
Baths
1,290
Sq Ft
$229/Sq Ft
Est. Value
About This Home
This home is located at 717 NW 3rd St, Ontario, ID 97914 and is currently estimated at $295,270, approximately $228 per square foot. 717 NW 3rd St is a home located in Malheur County with nearby schools including Ontario High School, Four Rivers Community School, and St. Peter Catholic School.
Ownership History
Date
Name
Owned For
Owner Type
Purchase Details
Closed on
Jan 14, 2019
Sold by
Alva Carina
Bought by
Paddock Kim D
Current Estimated Value
Home Financials for this Owner
Home Financials are based on the most recent Mortgage that was taken out on this home.
Original Mortgage
$137,365
Outstanding Balance
$122,312
Interest Rate
5.25%
Mortgage Type
FHA
Estimated Equity
$172,958
Purchase Details
Closed on
Jul 28, 2017
Sold by
Fannie Mae
Bought by
Meza Nancy
Purchase Details
Closed on
Nov 11, 2016
Sold by
Billingsley Michele and Brothers Micheal
Bought by
Federal National Mortgage Association
Purchase Details
Closed on
Feb 3, 2015
Sold by
Lewallen James H and Lewallen Hisako
Bought by
Billingsley Michele and Brothers Michael
Home Financials for this Owner
Home Financials are based on the most recent Mortgage that was taken out on this home.
Original Mortgage
$68,000
Interest Rate
3.76%
Mortgage Type
New Conventional
Create a Home Valuation Report for This Property
The Home Valuation Report is an in-depth analysis detailing your home's value as well as a comparison with similar homes in the area
Home Values in the Area
Average Home Value in this Area
Purchase History
| Date | Buyer | Sale Price | Title Company |
|---|---|---|---|
| Paddock Kim D | $139,900 | Amerititle | |
| Meza Nancy | $63,000 | Amerititle | |
| Federal National Mortgage Association | $66,200 | None Available | |
| Billingsley Michele | $85,000 | Malheur County Title Company |
Source: Public Records
Mortgage History
| Date | Status | Borrower | Loan Amount |
|---|---|---|---|
| Open | Paddock Kim D | $137,365 | |
| Previous Owner | Billingsley Michele | $68,000 |
Source: Public Records
Tax History Compared to Growth
Tax History
| Year | Tax Paid | Tax Assessment Tax Assessment Total Assessment is a certain percentage of the fair market value that is determined by local assessors to be the total taxable value of land and additions on the property. | Land | Improvement |
|---|---|---|---|---|
| 2024 | $2,105 | $137,200 | $41,616 | $95,584 |
| 2023 | $2,050 | $133,204 | $46,249 | $86,955 |
| 2022 | $1,995 | $129,325 | $51,021 | $78,304 |
| 2021 | $1,944 | $125,559 | $52,698 | $72,861 |
| 2020 | $1,892 | $121,902 | $50,895 | $71,007 |
| 2019 | $1,842 | $118,352 | $42,303 | $76,049 |
| 2018 | $1,723 | $114,905 | $42,109 | $72,796 |
| 2017 | $1,674 | $111,559 | $36,318 | $75,241 |
| 2016 | $1,585 | $108,310 | $35,260 | $73,050 |
| 2015 | $1,573 | $106,493 | $36,270 | $70,223 |
| 2014 | $1,522 | $103,392 | $37,799 | $65,593 |
Source: Public Records
Map
Nearby Homes
- 717 NW 2nd St
- 687 NW 2nd St
- 173 NW 7th Ave
- 684 NW 6th St
- 650 NW 6th St
- 510 NW 1st St
- 411 NW 1st St
- 124 NW 4th Ave
- 345 NW 7th St
- 297 NW 8th St
- 82 NW 3rd St
- 235 W Idaho Ave
- 146 NW 9th St
- 99 NW 9th St
- TBD Kimball Rd
- 1054 NW 2nd Ave
- 1069 Lucky Ln
- 285 SW 3rd St
- 287 SW 6th St Units 1&2
- 297 SW 6th St Units 1&2
- 717 NW 3rd St
- 703 NW 3rd St
- 733 NW 3rd St
- 714 Fortner St
- 347 NW 7th Ave
- 745 NW 3rd St
- 718 NW 3rd St
- 732 Fortner St
- 726 NW 3rd St
- 740 Fortner St
- 740 NW 3rd St
- 277 NW 7th Ave
- 695 NW 3rd St
- 750 NW 3rd St
- 751 NW 3rd St Unit 751
- 751 NW 3rd St Unit 753
- 751 NW 3rd St
- 684 Fortner St
- 294 NW 7th Ave
- 685 NW 3rd St