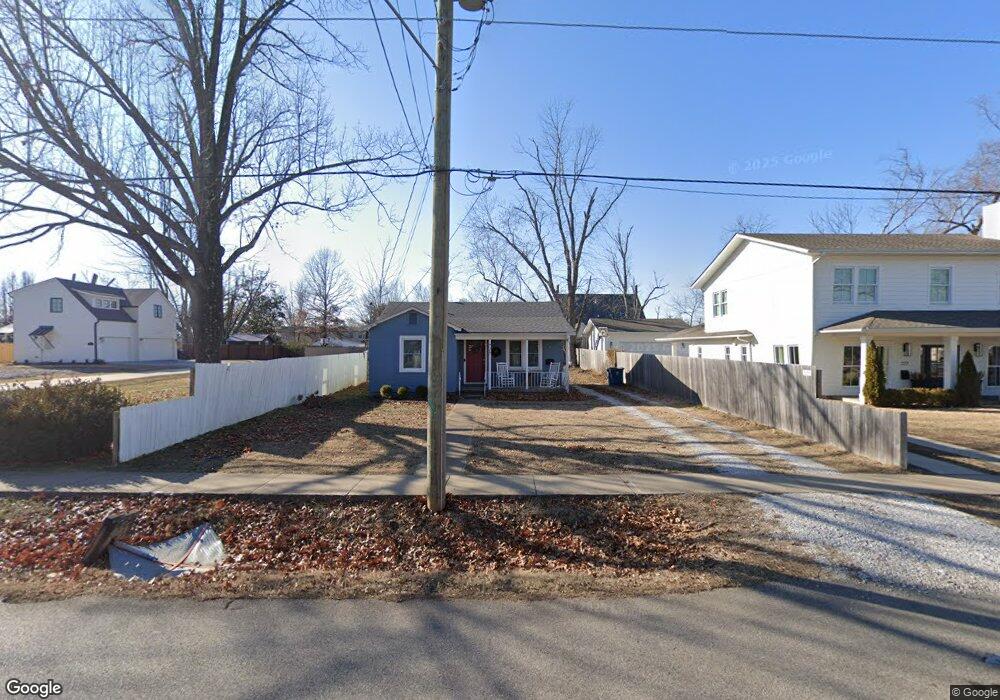
717 NW A St Bentonville, AR 72712
Estimated Value: $430,000 - $578,000
--
Bed
--
Bath
744
Sq Ft
$693/Sq Ft
Est. Value
About This Home
This home is located at 717 NW A St, Bentonville, AR 72712 and is currently estimated at $515,280, approximately $692 per square foot. 717 NW A St is a home with nearby schools including Sugar Creek Elementary School, Lincoln Junior High School, and Old High Middle School.
Ownership History
Date
Name
Owned For
Owner Type
Purchase Details
Closed on
Jul 14, 2011
Sold by
Atkins Jackie and Atkins Charlotte Sue
Bought by
Rowse James
Current Estimated Value
Home Financials for this Owner
Home Financials are based on the most recent Mortgage that was taken out on this home.
Original Mortgage
$36,000
Outstanding Balance
$24,790
Interest Rate
4.53%
Mortgage Type
New Conventional
Estimated Equity
$490,490
Purchase Details
Closed on
Dec 3, 2010
Sold by
Hesse Cheryl
Bought by
Atkins Charlotte Sue and Atkins Jackie
Purchase Details
Closed on
Nov 19, 1975
Bought by
Evans
Create a Home Valuation Report for This Property
The Home Valuation Report is an in-depth analysis detailing your home's value as well as a comparison with similar homes in the area
Home Values in the Area
Average Home Value in this Area
Purchase History
| Date | Buyer | Sale Price | Title Company |
|---|---|---|---|
| Rowse James | $45,000 | Mercury Title Llc | |
| Atkins Charlotte Sue | $28,000 | None Available | |
| Evans | $13,000 | -- |
Source: Public Records
Mortgage History
| Date | Status | Borrower | Loan Amount |
|---|---|---|---|
| Open | Rowse James | $36,000 |
Source: Public Records
Tax History Compared to Growth
Tax History
| Year | Tax Paid | Tax Assessment Tax Assessment Total Assessment is a certain percentage of the fair market value that is determined by local assessors to be the total taxable value of land and additions on the property. | Land | Improvement |
|---|---|---|---|---|
| 2025 | $1,452 | $94,148 | $72,569 | $21,579 |
| 2024 | $1,337 | $94,148 | $72,569 | $21,579 |
| 2023 | $1,216 | $48,950 | $42,950 | $6,000 |
| 2022 | $1,150 | $48,950 | $42,950 | $6,000 |
| 2021 | $1,050 | $48,950 | $42,950 | $6,000 |
| 2020 | $964 | $29,240 | $26,660 | $2,580 |
| 2019 | $901 | $29,240 | $26,660 | $2,580 |
| 2018 | $837 | $29,240 | $26,660 | $2,580 |
| 2017 | $687 | $29,240 | $26,660 | $2,580 |
| 2016 | $687 | $29,240 | $26,660 | $2,580 |
| 2015 | $617 | $9,980 | $4,000 | $5,980 |
| 2014 | $267 | $9,980 | $4,000 | $5,980 |
Source: Public Records
Map
Nearby Homes