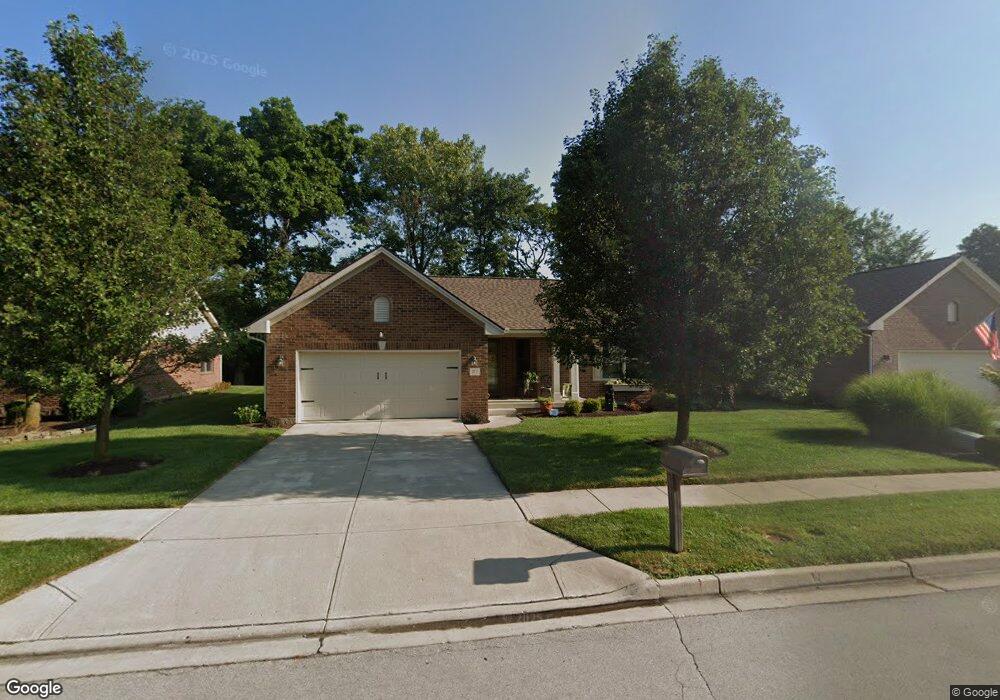
717 Overla Blvd Clayton, OH 45315
Estimated Value: $283,000 - $312,173
2
Beds
2
Baths
1,943
Sq Ft
$151/Sq Ft
Est. Value
About This Home
This home is located at 717 Overla Blvd, Clayton, OH 45315 and is currently estimated at $293,793, approximately $151 per square foot. 717 Overla Blvd is a home located in Montgomery County with nearby schools including Englewood Hills Elementary School, Northmont High School, and Trotwood Preparatory & Fitness Academy.
Ownership History
Date
Name
Owned For
Owner Type
Purchase Details
Closed on
Dec 18, 2020
Sold by
Terrace Lindsey R
Bought by
Terrace Ronald M and Terrace Verlaine G
Current Estimated Value
Home Financials for this Owner
Home Financials are based on the most recent Mortgage that was taken out on this home.
Original Mortgage
$120,000
Outstanding Balance
$106,855
Interest Rate
2.71%
Mortgage Type
New Conventional
Estimated Equity
$186,938
Purchase Details
Closed on
Oct 30, 2020
Sold by
Rapp Roberta M
Bought by
Terrace Lindsey R
Home Financials for this Owner
Home Financials are based on the most recent Mortgage that was taken out on this home.
Original Mortgage
$120,000
Outstanding Balance
$106,855
Interest Rate
2.71%
Mortgage Type
New Conventional
Estimated Equity
$186,938
Purchase Details
Closed on
Sep 8, 2017
Sold by
Rapp Roberta M
Bought by
Rapp Roberta M
Purchase Details
Closed on
Jun 13, 2003
Sold by
Millwood Village Development Co Llc
Bought by
Rapp Roberta M and Roberta M Rapp Revocable Living Trust
Create a Home Valuation Report for This Property
The Home Valuation Report is an in-depth analysis detailing your home's value as well as a comparison with similar homes in the area
Home Values in the Area
Average Home Value in this Area
Purchase History
| Date | Buyer | Sale Price | Title Company |
|---|---|---|---|
| Terrace Ronald M | $187,000 | Sterling Land Title Agcy Inc | |
| Terrace Lindsey R | $190,000 | Sterling Land Title Agcy Inc | |
| Rapp Roberta M | -- | None Available | |
| Rapp Roberta M | $174,300 | -- |
Source: Public Records
Mortgage History
| Date | Status | Borrower | Loan Amount |
|---|---|---|---|
| Open | Terrace Ronald M | $120,000 |
Source: Public Records
Tax History Compared to Growth
Tax History
| Year | Tax Paid | Tax Assessment Tax Assessment Total Assessment is a certain percentage of the fair market value that is determined by local assessors to be the total taxable value of land and additions on the property. | Land | Improvement |
|---|---|---|---|---|
| 2024 | $5,148 | $99,620 | $19,850 | $79,770 |
| 2023 | $5,148 | $99,620 | $19,850 | $79,770 |
| 2022 | $4,809 | $73,790 | $14,700 | $59,090 |
| 2021 | $4,823 | $73,790 | $14,700 | $59,090 |
| 2020 | $4,736 | $73,790 | $14,700 | $59,090 |
| 2019 | $4,668 | $66,260 | $14,700 | $51,560 |
| 2018 | $4,583 | $66,260 | $14,700 | $51,560 |
| 2017 | $4,530 | $66,260 | $14,700 | $51,560 |
| 2016 | $4,292 | $62,300 | $14,700 | $47,600 |
| 2015 | $3,922 | $62,300 | $14,700 | $47,600 |
| 2014 | $3,922 | $62,300 | $14,700 | $47,600 |
| 2012 | -- | $59,480 | $19,250 | $40,230 |
Source: Public Records
Map
Nearby Homes
- 108 Denwood Trail
- 306 Pauly Dr
- 534 Unger Ave
- 510 Rohr Ln
- 4245 W Wenger Rd
- 206 Lodestone Dr
- 830 W Wenger Rd
- 900 Moonlight Dr
- 206 Gardengrove Way
- 109 Silverstone Dr
- 104 Silverstone Dr
- 803 Albert St
- 208 S Walnut St
- 108 Tate Ave
- 607 Albert St
- 250 Winter Creek Ct
- 408 W Herr St
- 123 Chestnut St
- 881 Sunset Dr
- 510 Lambert Ln
- 717 Overla Blvd
- 719 Overla Blvd
- 715 Overla Blvd
- 721 Overla Blvd
- 713 Overla Blvd
- 131 Millwood Village Dr
- 723 Overla Blvd
- 129 Millwood Village Dr
- 130 Millwood Village Dr
- 103 Millwood Village Dr
- 725 Overla Blvd
- 709 Overla Blvd
- 105 Millwood Village Dr
- 100 Millwood Village Dr
- 500 Mallee Ct
- 126 Millwood Village Dr
- 119 Millwood Village Dr
- 102 Millwood Village Dr
- 727 Overla Blvd
- 115 Millwood Village Dr