Estimated Value: $357,000 - $398,000
4
Beds
2
Baths
1,953
Sq Ft
$192/Sq Ft
Est. Value
About This Home
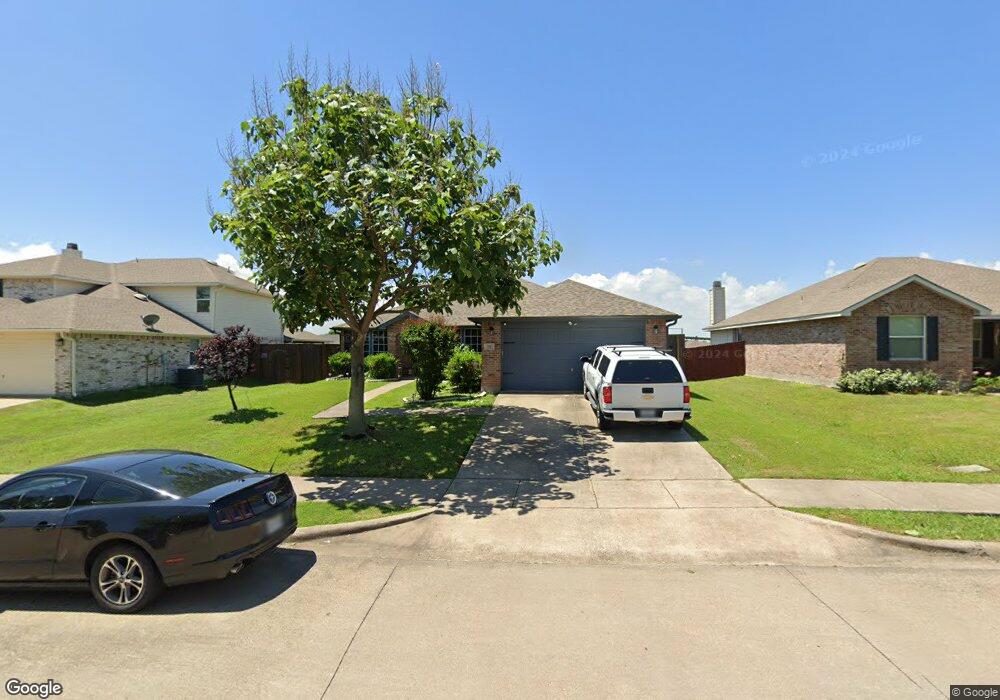
This home is located at 717 Rainsville Dr, Wylie, TX 75098 and is currently estimated at $374,020, approximately $191 per square foot. 717 Rainsville Dr is a home located in Collin County with nearby schools including T.F. Birmingham Elementary School, Frank Mcmillan Junior High School, and Davis Intermediate School.
Ownership History
Date
Name
Owned For
Owner Type
Purchase Details
Closed on
Aug 30, 2023
Sold by
Kotsopoulos Michael and Kotsopoulos Renee Ann
Bought by
Kotsopoulos
Current Estimated Value
Purchase Details
Closed on
Sep 25, 2017
Sold by
Gothard Gothard V and Gothard Janene Elizabeth
Bought by
Kotsopoulos Michael and Kotsopoulos Renee Ann
Home Financials for this Owner
Home Financials are based on the most recent Mortgage that was taken out on this home.
Original Mortgage
$200,000
Interest Rate
3.9%
Mortgage Type
New Conventional
Purchase Details
Closed on
Jul 28, 2005
Sold by
Centex Homes
Bought by
Gothard V John Thomas and Gothard Janene Elizabeth
Home Financials for this Owner
Home Financials are based on the most recent Mortgage that was taken out on this home.
Original Mortgage
$103,500
Interest Rate
7.4%
Mortgage Type
Fannie Mae Freddie Mac
Create a Home Valuation Report for This Property
The Home Valuation Report is an in-depth analysis detailing your home's value as well as a comparison with similar homes in the area
Home Values in the Area
Average Home Value in this Area
Purchase History
| Date | Buyer | Sale Price | Title Company |
|---|---|---|---|
| Kotsopoulos | -- | None Listed On Document | |
| Kotsopoulos Michael | -- | None Available | |
| Gothard V John Thomas | -- | -- |
Source: Public Records
Mortgage History
| Date | Status | Borrower | Loan Amount |
|---|---|---|---|
| Previous Owner | Kotsopoulos Michael | $200,000 | |
| Previous Owner | Gothard V John Thomas | $103,500 | |
| Closed | Gothard V John Thomas | $25,900 |
Source: Public Records
Tax History Compared to Growth
Tax History
| Year | Tax Paid | Tax Assessment Tax Assessment Total Assessment is a certain percentage of the fair market value that is determined by local assessors to be the total taxable value of land and additions on the property. | Land | Improvement |
|---|---|---|---|---|
| 2025 | $5,694 | $389,488 | $99,750 | $296,762 |
| 2024 | $5,694 | $354,080 | $99,750 | $277,250 |
| 2023 | $5,694 | $321,891 | $89,250 | $264,754 |
| 2022 | $6,420 | $292,628 | $89,250 | $244,431 |
| 2021 | $6,259 | $266,025 | $68,250 | $197,775 |
| 2020 | $6,288 | $253,234 | $57,750 | $195,484 |
| 2019 | $6,706 | $255,207 | $57,750 | $197,457 |
| 2018 | $6,571 | $244,006 | $57,750 | $186,256 |
| 2017 | $5,661 | $223,624 | $52,500 | $171,124 |
| 2016 | $5,309 | $196,265 | $42,000 | $154,265 |
| 2015 | $4,214 | $176,460 | $36,750 | $139,710 |
Source: Public Records
Map
Nearby Homes
- 713 Kinston Ct
- 705 Baldwin Rd
- 1312 Meziere Sky Dr
- 605 Graham Ct
- 514 Brighton Ct
- 626 Gunters Mountain Ln
- 517 E Gaston Dr
- 502 E Gaston Dr
- 410 Oxford Dr
- 2049 Quail Run Rd
- 1403 Lakeview Dr
- 902 Greene Way
- 423 N Winding Oaks Dr
- 550 Parker Rd
- 908 Greene Way
- 907 Carlton Rd
- 1003 Ann Dr
- 913 Chickesaw Ln
- 410 N Winding Oaks Dr
- 1305 Mobile Ln
- 715 Rainsville Dr
- 719 Rainsville Dr
- 721 Rainsville Dr
- 716 Gallant Ct
- 714 Gallant Ct
- 718 Gallant Ct
- 700 Ashford Ln
- 702 Ashford Ln
- 722 Rainsville Dr
- 704 Ashford Ln
- 720 Rainsville Dr
- 724 Rainsville Dr
- 720 Gallant Ct
- 718 Rainsville Dr
- 726 Rainsville Dr
- 706 Ashford Ln
- 716 Rainsville Dr
- 708 Ashford Ln
- 702 Cedar Bluff Dr
- 704 Cedar Bluff Dr