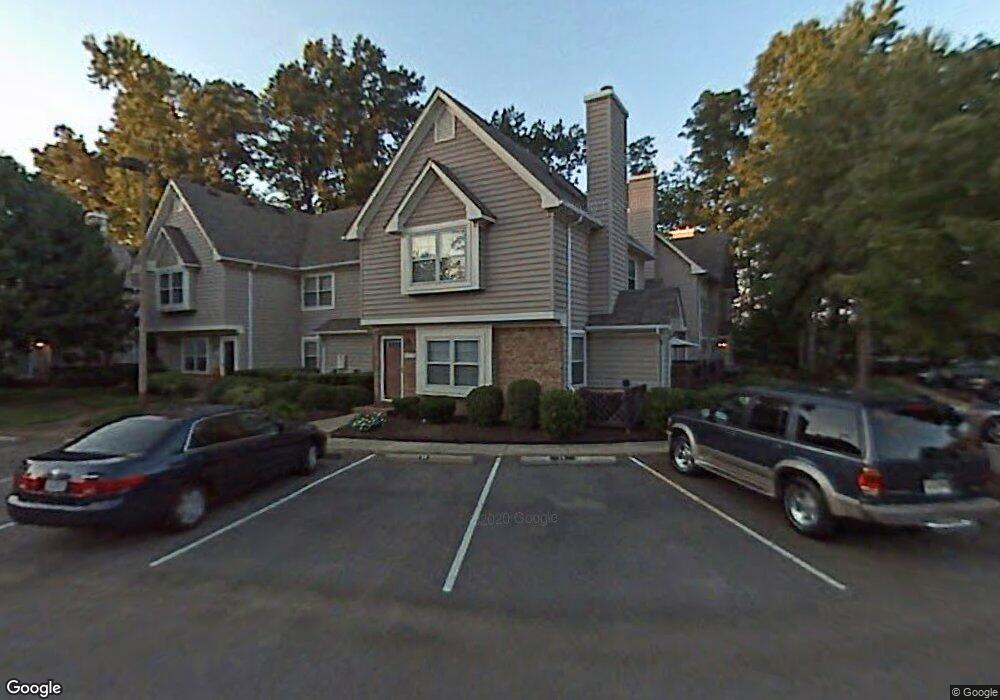
717 Rapidan River Ct Unit E Chesapeake, VA 23320
Greenbrier West NeighborhoodEstimated Value: $231,000 - $247,000
2
Beds
2
Baths
1,179
Sq Ft
$201/Sq Ft
Est. Value
About This Home
This home is located at 717 Rapidan River Ct Unit E, Chesapeake, VA 23320 and is currently estimated at $236,461, approximately $200 per square foot. 717 Rapidan River Ct Unit E is a home located in Chesapeake City with nearby schools including B.M. Williams Primary School, Crestwood Intermediate School, and Crestwood Middle School.
Ownership History
Date
Name
Owned For
Owner Type
Purchase Details
Closed on
Oct 25, 2016
Sold by
Jackson Carlette M
Bought by
Smith Erika G
Current Estimated Value
Home Financials for this Owner
Home Financials are based on the most recent Mortgage that was taken out on this home.
Original Mortgage
$146,301
Outstanding Balance
$116,820
Interest Rate
3.25%
Mortgage Type
FHA
Estimated Equity
$119,641
Purchase Details
Closed on
Jul 9, 2002
Sold by
Crawford Kristin
Bought by
Mendoza Carlette
Home Financials for this Owner
Home Financials are based on the most recent Mortgage that was taken out on this home.
Original Mortgage
$82,353
Interest Rate
6.73%
Purchase Details
Closed on
Jun 10, 1999
Sold by
Lashinger Robert G
Bought by
Crawford Kristin R
Home Financials for this Owner
Home Financials are based on the most recent Mortgage that was taken out on this home.
Original Mortgage
$72,750
Interest Rate
6.99%
Create a Home Valuation Report for This Property
The Home Valuation Report is an in-depth analysis detailing your home's value as well as a comparison with similar homes in the area
Home Values in the Area
Average Home Value in this Area
Purchase History
| Date | Buyer | Sale Price | Title Company |
|---|---|---|---|
| Smith Erika G | $149,000 | Attorney | |
| Mendoza Carlette | $85,000 | -- | |
| Crawford Kristin R | $75,000 | -- |
Source: Public Records
Mortgage History
| Date | Status | Borrower | Loan Amount |
|---|---|---|---|
| Open | Smith Erika G | $146,301 | |
| Previous Owner | Mendoza Carlette | $82,353 | |
| Previous Owner | Crawford Kristin R | $72,750 |
Source: Public Records
Tax History
| Year | Tax Paid | Tax Assessment Tax Assessment Total Assessment is a certain percentage of the fair market value that is determined by local assessors to be the total taxable value of land and additions on the property. | Land | Improvement |
|---|---|---|---|---|
| 2025 | $2,327 | $233,400 | $95,000 | $138,400 |
| 2024 | $2,327 | $230,400 | $90,000 | $140,400 |
| 2023 | $1,861 | $204,100 | $65,000 | $139,100 |
| 2022 | $1,838 | $182,000 | $55,000 | $127,000 |
| 2021 | $1,707 | $162,600 | $45,000 | $117,600 |
| 2020 | $1,675 | $159,500 | $45,000 | $114,500 |
| 2019 | $1,622 | $154,500 | $40,000 | $114,500 |
| 2018 | $1,512 | $114,300 | $35,000 | $79,300 |
| 2017 | $1,277 | $121,600 | $35,000 | $86,600 |
| 2016 | $1,173 | $111,700 | $35,000 | $76,700 |
| 2015 | $1,200 | $114,300 | $35,000 | $79,300 |
| 2014 | $1,368 | $130,300 | $35,000 | $95,300 |
Source: Public Records
Map
Nearby Homes
- 823 Rivanna River Reach
- 821 Shipton Ct
- 516 Rue Marseille
- 828 Hardwood Dr
- 431 Supplejack Ct
- 818 Rue Marseille
- 802 Sutherland Arch
- 306 Primrose Ln
- 404 Primrose Ln
- 508 Rue Saint La Rogue
- 600 Rue Saint La Rogue
- 2312 Willow Point Arch
- 809 Huntly Dr
- 836 Wickford Dr
- 700 Cross Quay
- 704 Inlet Quay Unit J
- 707 Sailfish Quay
- 326 Esplanade Place
- 712 Inlet Quay Unit A
- 559 Seahorse Run
- 717 Rapidan River Ct Unit C
- 717 Rapidan River Ct
- 717 Rapidan River Ct
- 717 Rapidan River Ct
- 717 Rapidan River Ct
- 717 Rapidan River Ct
- 717 Rapidan River Ct
- 717 Rapidan River Ct
- 717 Rapidan River Ct
- 717 Rapidan River Ct
- 717 Rapidan River Ct Unit C
- 717 Rapidan River Ct Unit F
- 717 Rapidan River Ct Unit A
- 717 Rapidan River Ct Unit B
- 717 Rapidan River Ct Unit D
- 713 B Rapidan River Ct Unit B
- 713 Rapidan River Ct Unit A
- 713 Rapidan River Ct
- 713 Rapidan River Ct
- 713 Rapidan River Ct
Your Personal Tour Guide
Ask me questions while you tour the home.