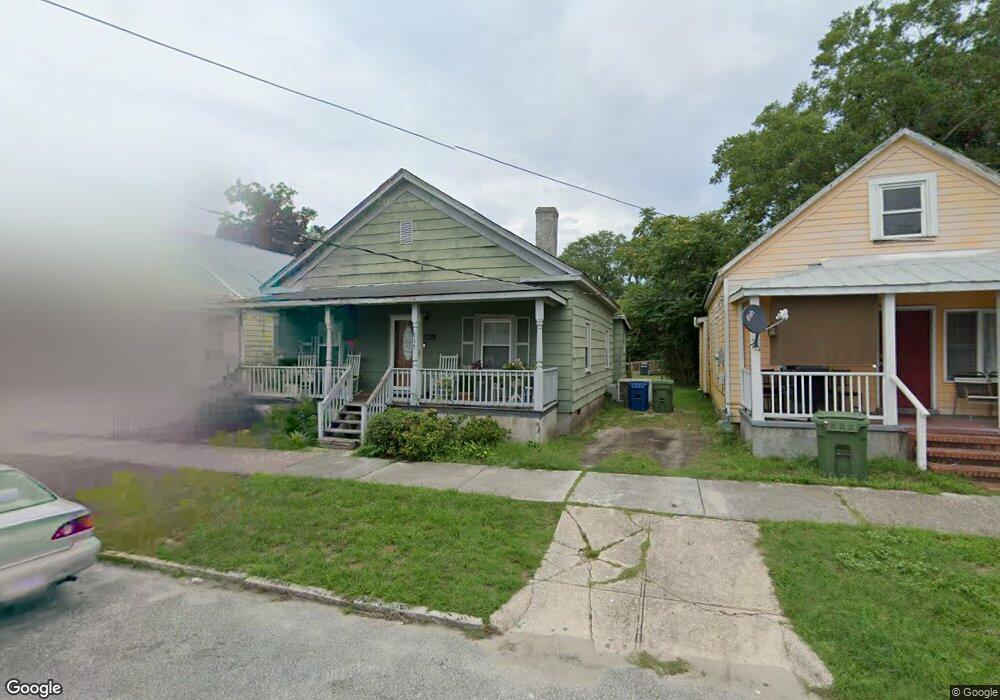
717 S 6th St Wilmington, NC 28401
Dry Pond-South Side NeighborhoodEstimated Value: $199,741 - $314,000
2
Beds
1
Bath
1,237
Sq Ft
$204/Sq Ft
Est. Value
About This Home
This home is located at 717 S 6th St, Wilmington, NC 28401 and is currently estimated at $252,435, approximately $204 per square foot. 717 S 6th St is a home located in New Hanover County with nearby schools including Snipes Academy of Arts & Design, Williston Middle School, and John T. Hoggard High School.
Ownership History
Date
Name
Owned For
Owner Type
Purchase Details
Closed on
May 13, 2022
Sold by
Mckoy Batts Amelia
Bought by
Batts Amelia Mckoy and Thomas Amelia Batts
Current Estimated Value
Purchase Details
Closed on
Feb 1, 1996
Sold by
Batts George Washington Sr
Bought by
Batts Amelia
Purchase Details
Closed on
Aug 1, 1986
Sold by
Richburg James E Margie B
Bought by
Batts George W Sr Amelia
Purchase Details
Closed on
Jul 1, 1974
Bought by
Richburg James E Margie B
Create a Home Valuation Report for This Property
The Home Valuation Report is an in-depth analysis detailing your home's value as well as a comparison with similar homes in the area
Home Values in the Area
Average Home Value in this Area
Purchase History
| Date | Buyer | Sale Price | Title Company |
|---|---|---|---|
| Batts Amelia Mckoy | -- | None Listed On Document | |
| Batts Amelia | -- | -- | |
| Batts George W Sr Amelia | $13,000 | -- | |
| Richburg James E Margie B | -- | -- |
Source: Public Records
Tax History Compared to Growth
Tax History
| Year | Tax Paid | Tax Assessment Tax Assessment Total Assessment is a certain percentage of the fair market value that is determined by local assessors to be the total taxable value of land and additions on the property. | Land | Improvement |
|---|---|---|---|---|
| 2025 | $463 | $157,500 | $94,100 | $63,400 |
| 2023 | $607 | $139,600 | $45,300 | $94,300 |
| 2022 | $593 | $139,600 | $45,300 | $94,300 |
| 2021 | $597 | $139,600 | $45,300 | $94,300 |
| 2020 | $284 | $53,900 | $9,400 | $44,500 |
| 2019 | $284 | $53,900 | $9,400 | $44,500 |
| 2018 | $284 | $53,900 | $9,400 | $44,500 |
| 2017 | $284 | $53,900 | $9,400 | $44,500 |
| 2016 | $90 | $33,100 | $15,200 | $17,900 |
| 2015 | $86 | $33,100 | $15,200 | $17,900 |
| 2014 | $82 | $33,100 | $15,200 | $17,900 |
Source: Public Records
Map
Nearby Homes