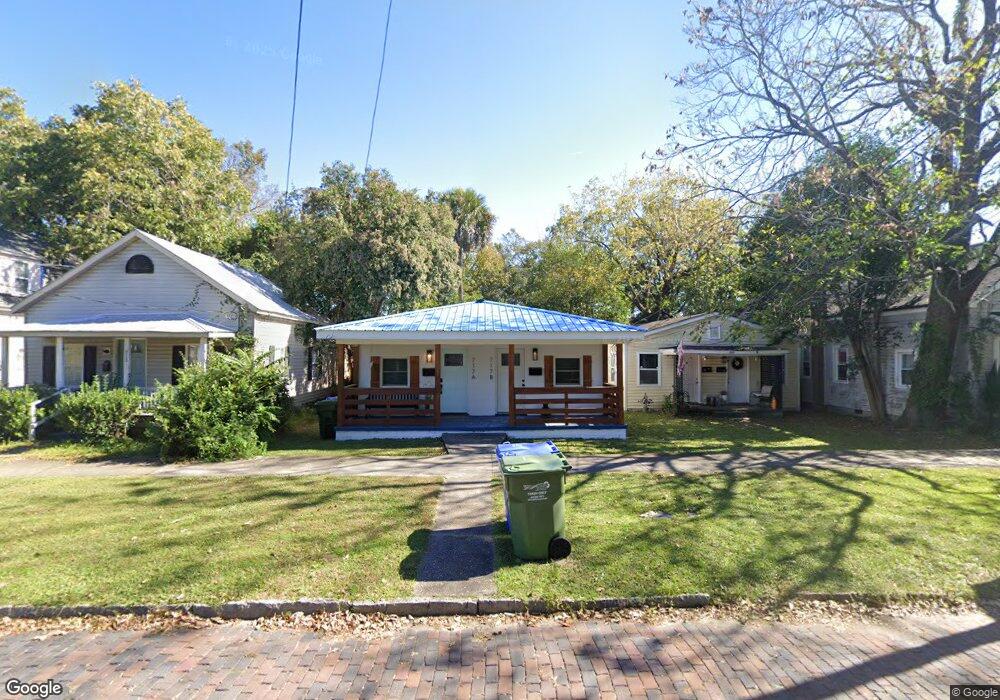
717 S 7th St Wilmington, NC 28401
Dry Pond-South Side NeighborhoodEstimated Value: $527,509 - $608,000
4
Beds
3
Baths
1,508
Sq Ft
$383/Sq Ft
Est. Value
About This Home
This home is located at 717 S 7th St, Wilmington, NC 28401 and is currently estimated at $577,377, approximately $382 per square foot. 717 S 7th St is a home located in New Hanover County with nearby schools including Snipes Academy of Arts & Design, Williston Middle School, and John T. Hoggard High School.
Ownership History
Date
Name
Owned For
Owner Type
Purchase Details
Closed on
Mar 14, 2022
Sold by
Quintard Cherry Iv Charles and Quintard Kate
Bought by
Umana Bryant
Current Estimated Value
Home Financials for this Owner
Home Financials are based on the most recent Mortgage that was taken out on this home.
Original Mortgage
$413,250
Outstanding Balance
$385,803
Interest Rate
3.85%
Mortgage Type
Balloon
Estimated Equity
$191,574
Purchase Details
Closed on
Jan 1, 2001
Bought by
Tucker Marie
Purchase Details
Closed on
Dec 15, 1998
Sold by
Tucker Marie
Bought by
Jackson Elgin
Create a Home Valuation Report for This Property
The Home Valuation Report is an in-depth analysis detailing your home's value as well as a comparison with similar homes in the area
Home Values in the Area
Average Home Value in this Area
Purchase History
| Date | Buyer | Sale Price | Title Company |
|---|---|---|---|
| Umana Bryant | $551,000 | Price & Williams Pa | |
| Cherry Charles Quintard | $207,000 | Price & Williams Pa | |
| Tucker Marie | -- | -- | |
| Jackson Elgin | $25,000 | -- |
Source: Public Records
Mortgage History
| Date | Status | Borrower | Loan Amount |
|---|---|---|---|
| Open | Umana Bryant | $413,250 |
Source: Public Records
Tax History Compared to Growth
Tax History
| Year | Tax Paid | Tax Assessment Tax Assessment Total Assessment is a certain percentage of the fair market value that is determined by local assessors to be the total taxable value of land and additions on the property. | Land | Improvement |
|---|---|---|---|---|
| 2025 | $3,590 | $610,100 | $115,000 | $495,100 |
| 2023 | $3,159 | $363,100 | $58,200 | $304,900 |
| 2022 | $2,704 | $318,100 | $58,200 | $259,900 |
| 2021 | $2,722 | $318,100 | $58,200 | $259,900 |
| 2020 | $1,500 | $142,400 | $15,600 | $126,800 |
| 2019 | $1,500 | $142,400 | $15,600 | $126,800 |
| 2018 | $1,500 | $142,400 | $15,600 | $126,800 |
| 2017 | $1,500 | $142,400 | $15,600 | $126,800 |
| 2016 | $1,156 | $104,300 | $28,700 | $75,600 |
| 2015 | $1,105 | $104,300 | $28,700 | $75,600 |
| 2014 | $1,058 | $104,300 | $28,700 | $75,600 |
Source: Public Records
Map
Nearby Homes