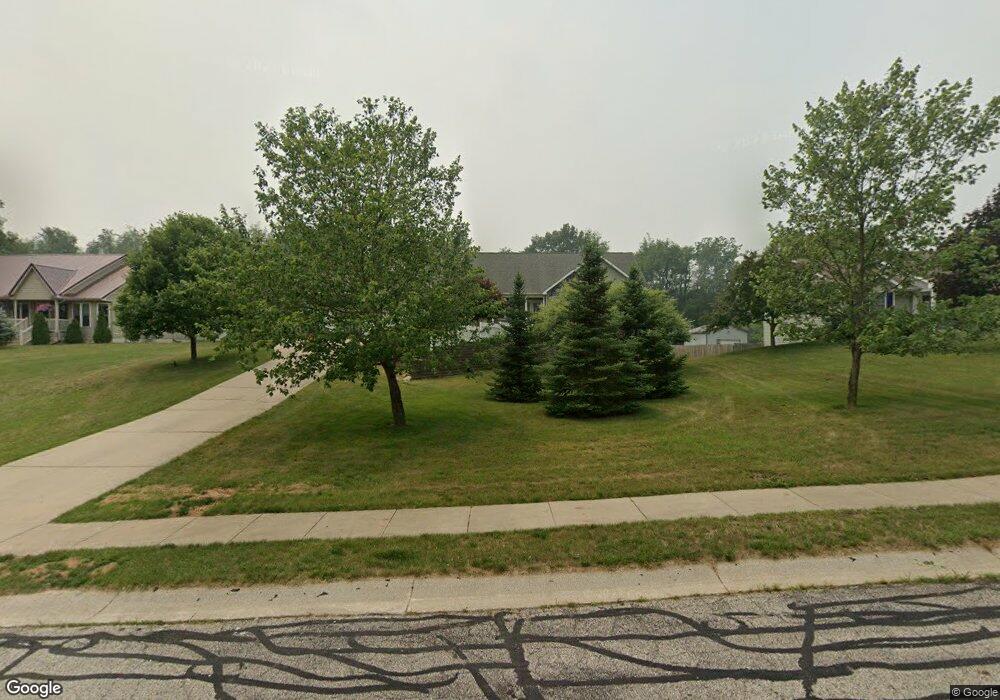
717 S Bray St New Carlisle, IN 46552
Estimated Value: $431,000 - $590,000
3
Beds
2
Baths
3,652
Sq Ft
$138/Sq Ft
Est. Value
About This Home
This home is located at 717 S Bray St, New Carlisle, IN 46552 and is currently estimated at $504,654, approximately $138 per square foot. 717 S Bray St is a home located in St. Joseph County with nearby schools including New Prairie High School.
Ownership History
Date
Name
Owned For
Owner Type
Purchase Details
Closed on
Jul 30, 2018
Sold by
Chapple Sean C R
Bought by
Chapple Sean C R and Chapple Katherine M
Current Estimated Value
Purchase Details
Closed on
Jul 23, 2018
Sold by
Chapple Sean C R
Bought by
Chapple Sean C R and Chapple Katherine M
Purchase Details
Closed on
Sep 19, 2011
Sold by
Pappa David W and Pappa Jill M
Bought by
Chapple Sean C R
Home Financials for this Owner
Home Financials are based on the most recent Mortgage that was taken out on this home.
Original Mortgage
$166,650
Interest Rate
3.5%
Mortgage Type
FHA
Purchase Details
Closed on
Mar 7, 2006
Sold by
Smith Gregory J
Bought by
Pappa David W and Pappa Jull M
Home Financials for this Owner
Home Financials are based on the most recent Mortgage that was taken out on this home.
Original Mortgage
$254,118
Interest Rate
6.22%
Mortgage Type
VA
Create a Home Valuation Report for This Property
The Home Valuation Report is an in-depth analysis detailing your home's value as well as a comparison with similar homes in the area
Home Values in the Area
Average Home Value in this Area
Purchase History
| Date | Buyer | Sale Price | Title Company |
|---|---|---|---|
| Chapple Sean C R | -- | None Listed On Document | |
| Chapple Sean C R | -- | None Available | |
| Chapple Sean C R | -- | Meridian Title Corp | |
| Pappa David W | -- | Metropolitan Title Llc |
Source: Public Records
Mortgage History
| Date | Status | Borrower | Loan Amount |
|---|---|---|---|
| Previous Owner | Chapple Sean C R | $166,650 | |
| Previous Owner | Pappa David W | $254,118 |
Source: Public Records
Tax History Compared to Growth
Tax History
| Year | Tax Paid | Tax Assessment Tax Assessment Total Assessment is a certain percentage of the fair market value that is determined by local assessors to be the total taxable value of land and additions on the property. | Land | Improvement |
|---|---|---|---|---|
| 2024 | $5,840 | $463,700 | $82,500 | $381,200 |
| 2023 | $3,892 | $296,500 | $66,600 | $229,900 |
| 2022 | $4,453 | $342,800 | $78,300 | $264,500 |
| 2021 | $3,739 | $278,000 | $36,100 | $241,900 |
| 2020 | $3,524 | $333,400 | $33,600 | $299,800 |
| 2019 | $3,419 | $248,900 | $24,500 | $224,400 |
| 2018 | $3,626 | $245,400 | $24,500 | $220,900 |
| 2017 | $3,658 | $241,100 | $24,500 | $216,600 |
| 2016 | $4,003 | $244,300 | $24,500 | $219,800 |
| 2014 | $2,918 | $205,300 | $24,500 | $180,800 |
Source: Public Records
Map
Nearby Homes
- 33671 Woodmont Ridge Dr
- 33811 Ferncrest Ct
- 54850 County Line Rd
- 55420 Forest Cove Ct
- 710 Thunderbird Dr
- 54760 County Line Rd
- 114 S Cherry St
- 732 W Michigan St
- 33791 Early Rd
- 750 W Michigan St
- 33740 Early Rd
- 33750 Early Rd
- 33800 Early Rd
- 55420 County Line Rd
- 33760 Early Rd
- 33770 Early Rd
- 33780 Early Rd
- 33790 Early Rd
- 528 W Elm St
- 33810 Early Rd