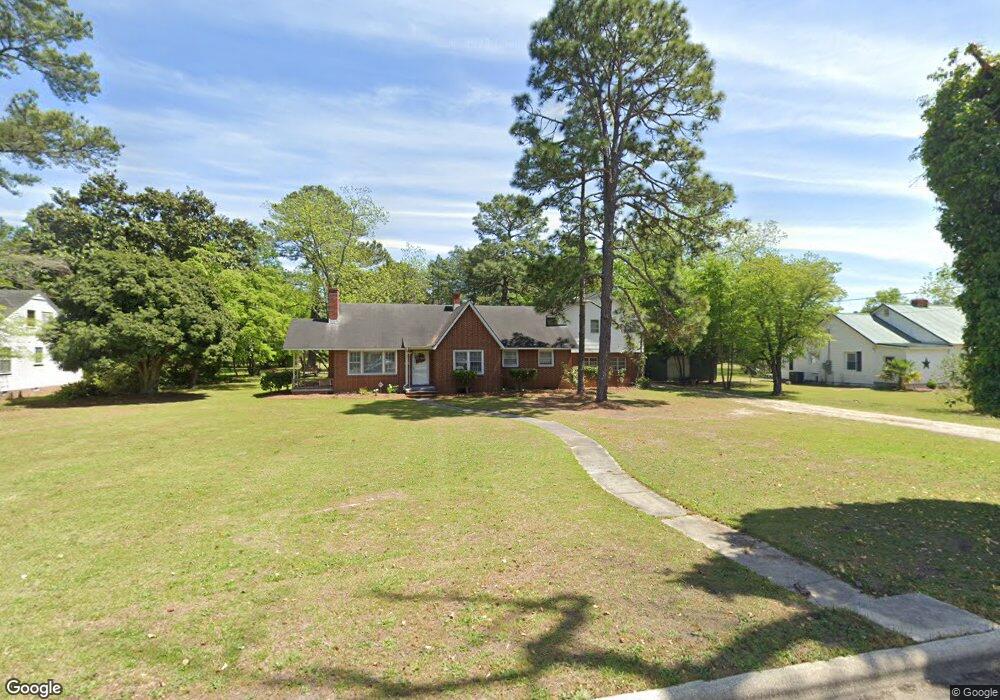
717 S Main St Red Springs, NC 28377
Estimated Value: $161,000 - $209,000
5
Beds
3
Baths
2,614
Sq Ft
$69/Sq Ft
Est. Value
About This Home
This home is located at 717 S Main St, Red Springs, NC 28377 and is currently estimated at $179,997, approximately $68 per square foot. 717 S Main St is a home located in Robeson County with nearby schools including Peterson Elementary School, Parkton Elementary School, and Red Springs Middle School.
Ownership History
Date
Name
Owned For
Owner Type
Purchase Details
Closed on
Aug 19, 2021
Sold by
Peterkin Timothy J
Bought by
Acatitlan Liz Yanin Villasana
Current Estimated Value
Purchase Details
Closed on
Nov 20, 2018
Sold by
Owens Genevieve Gales
Bought by
Peterkin Timothy J
Home Financials for this Owner
Home Financials are based on the most recent Mortgage that was taken out on this home.
Original Mortgage
$60,000
Interest Rate
4.9%
Mortgage Type
Seller Take Back
Create a Home Valuation Report for This Property
The Home Valuation Report is an in-depth analysis detailing your home's value as well as a comparison with similar homes in the area
Home Values in the Area
Average Home Value in this Area
Purchase History
| Date | Buyer | Sale Price | Title Company |
|---|---|---|---|
| Acatitlan Liz Yanin Villasana | $130,000 | None Available | |
| Peterkin Timothy J | $65,000 | None Available |
Source: Public Records
Mortgage History
| Date | Status | Borrower | Loan Amount |
|---|---|---|---|
| Previous Owner | Peterkin Timothy J | $60,000 |
Source: Public Records
Tax History Compared to Growth
Tax History
| Year | Tax Paid | Tax Assessment Tax Assessment Total Assessment is a certain percentage of the fair market value that is determined by local assessors to be the total taxable value of land and additions on the property. | Land | Improvement |
|---|---|---|---|---|
| 2025 | $2,257 | $156,600 | $17,600 | $139,000 |
| 2024 | $2,252 | $156,600 | $17,600 | $139,000 |
| 2023 | $1,354 | $92,700 | $16,000 | $76,700 |
| 2022 | $1,354 | $92,700 | $16,000 | $76,700 |
| 2021 | $1,030 | $69,200 | $16,000 | $53,200 |
| 2020 | $1,015 | $69,200 | $16,000 | $53,200 |
| 2018 | $1,036 | $53,900 | $5,000 | $48,900 |
| 2017 | $1,042 | $53,900 | $5,000 | $48,900 |
| 2016 | $1,042 | $53,900 | $5,000 | $48,900 |
| 2015 | $521 | $53,900 | $5,000 | $48,900 |
| 2014 | $521 | $53,900 | $5,000 | $48,900 |
Source: Public Records
Map
Nearby Homes
- 103 W Sunset Dr
- 400 Mcleod Rd
- Lot 21 Daniel McLeod Rd
- Lot 20 Daniel McLeod Rd
- Lot 19 Daniel McLeod Rd
- Lot 18 Daniel McLeod Rd
- Lot 17 Daniel McLeod Rd
- Lot 16 Daniel McLeod Rd
- Lot 15 Daniel McLeod Rd
- Lot 14 Daniel McLeod Rd
- Lot 13 Daniel McLeod Rd
- Lot 11 Daniel McLeod Rd
- Lot 10 Daniel McLeod Rd
- Lot 9 Daniel McLeod Rd
- Lot 8 Daniel McLeod Rd
- Lot 7 Daniel McLeod Rd
- Lot 6 Daniel McLeod Rd