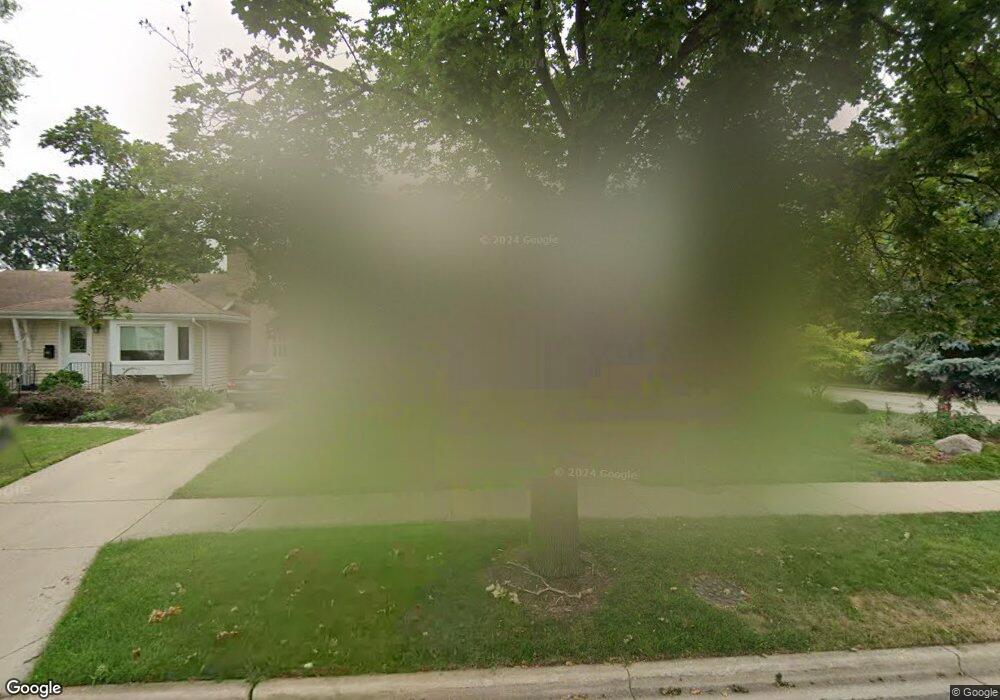
717 S Spring Rd Elmhurst, IL 60126
Estimated Value: $412,000 - $602,000
--
Bed
--
Bath
928
Sq Ft
$515/Sq Ft
Est. Value
About This Home
This home is located at 717 S Spring Rd, Elmhurst, IL 60126 and is currently estimated at $478,034, approximately $515 per square foot. 717 S Spring Rd is a home located in DuPage County with nearby schools including Lincoln Elementary School, Bryan Middle School, and York Community High School.
Ownership History
Date
Name
Owned For
Owner Type
Purchase Details
Closed on
May 18, 2009
Sold by
Balice Joseph P and Balice Jennifer
Bought by
Balice Gtuseppe and Balice Jennifer
Current Estimated Value
Purchase Details
Closed on
May 10, 1999
Sold by
The Old Second National Bank Of Aurora
Bought by
Balice Joseph P and Nacyk Jennifer A
Home Financials for this Owner
Home Financials are based on the most recent Mortgage that was taken out on this home.
Original Mortgage
$124,000
Outstanding Balance
$30,611
Interest Rate
6.5%
Estimated Equity
$447,423
Purchase Details
Closed on
Jan 29, 1998
Sold by
Frigolett Josephine
Bought by
The Old Second National Bank Of Aurora and Trust #48705500
Create a Home Valuation Report for This Property
The Home Valuation Report is an in-depth analysis detailing your home's value as well as a comparison with similar homes in the area
Home Values in the Area
Average Home Value in this Area
Purchase History
| Date | Buyer | Sale Price | Title Company |
|---|---|---|---|
| Balice Gtuseppe | -- | None Available | |
| Balice Joseph P | $155,000 | -- | |
| The Old Second National Bank Of Aurora | -- | -- |
Source: Public Records
Mortgage History
| Date | Status | Borrower | Loan Amount |
|---|---|---|---|
| Open | Balice Joseph P | $124,000 |
Source: Public Records
Tax History Compared to Growth
Tax History
| Year | Tax Paid | Tax Assessment Tax Assessment Total Assessment is a certain percentage of the fair market value that is determined by local assessors to be the total taxable value of land and additions on the property. | Land | Improvement |
|---|---|---|---|---|
| 2024 | $5,728 | $103,047 | $72,097 | $30,950 |
| 2023 | $5,299 | $95,290 | $66,670 | $28,620 |
| 2022 | $6,314 | $110,120 | $64,070 | $46,050 |
| 2021 | $6,154 | $107,380 | $62,480 | $44,900 |
| 2020 | $5,913 | $105,030 | $61,110 | $43,920 |
| 2019 | $5,782 | $99,860 | $58,100 | $41,760 |
| 2018 | $5,489 | $94,600 | $55,010 | $39,590 |
| 2017 | $5,362 | $90,150 | $52,420 | $37,730 |
| 2016 | $5,239 | $84,920 | $49,380 | $35,540 |
| 2015 | $5,174 | $79,110 | $46,000 | $33,110 |
| 2014 | $5,781 | $81,010 | $42,000 | $39,010 |
| 2013 | $5,720 | $82,150 | $42,590 | $39,560 |
Source: Public Records
Map
Nearby Homes
- 762 S Saylor Ave
- 634 S Spring Rd
- 801 S Spring Rd
- 663 S Hawthorne Ave
- 618 S Swain Ave
- 805 S Spring Rd
- 814 S Saylor Ave
- 816 S Spring Rd
- 740 S Berkley Ave
- 722 S Berkley Ave
- 611 S Prospect Ave
- 680 S Bryan St
- 769 S Fairview Ave
- 663 S Sunnyside Ave
- 570 S Parkside Ave
- 448 W Vallette St
- 28 Windsor Dr
- 15 Manchester Ln
- 694 S York St
- 936 S Mitchell Ave
- 713 S Spring Rd
- 727 S Spring Rd
- 709 S Spring Rd
- 000 Spring Rd
- 718 S Saylor Ave
- 714 S Saylor Ave
- 703 S Spring Rd
- 731 S Spring Rd
- 284 W Wilson St
- 718 S Spring Rd
- 714 S Spring Rd
- 710 S Saylor Ave
- 710 S Spring Rd
- 728 S Spring Rd
- 732 S Saylor Ave
- 701 S Spring Rd
- 706 S Saylor Ave
- 311 W Wilson St
- 706 S Spring Rd
- 734 S Saylor Ave