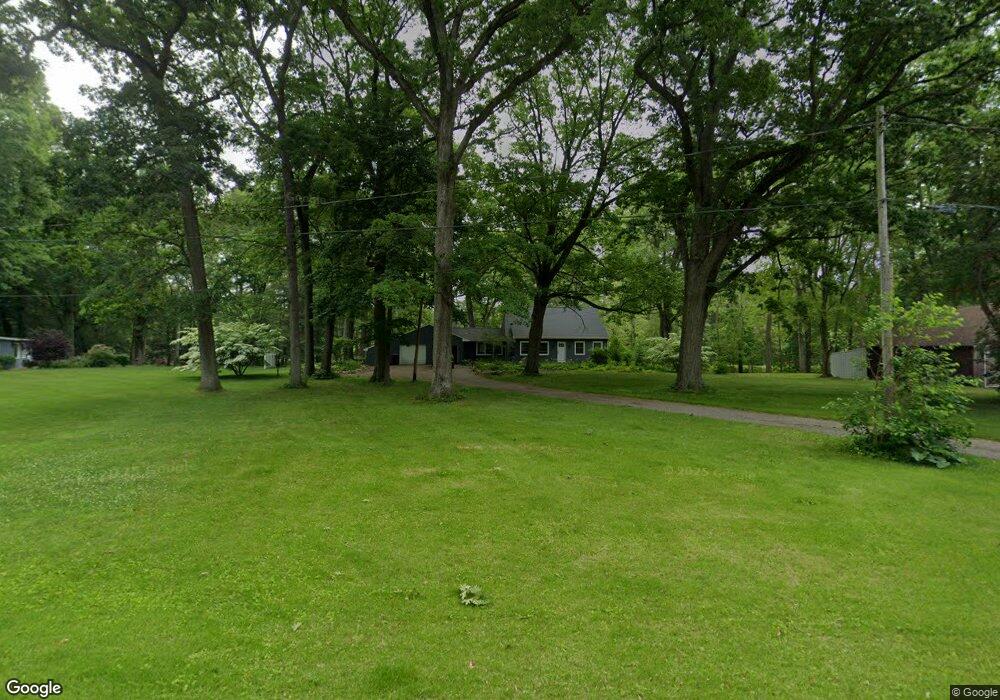
717 Sycamore Bend Plainwell, MI 49080
Estimated Value: $298,325 - $363,000
4
Beds
3
Baths
3,080
Sq Ft
$108/Sq Ft
Est. Value
About This Home
This home is located at 717 Sycamore Bend, Plainwell, MI 49080 and is currently estimated at $332,831, approximately $108 per square foot. 717 Sycamore Bend is a home located in Allegan County with nearby schools including Plainwell High School and Otsego Christian Academy.
Ownership History
Date
Name
Owned For
Owner Type
Purchase Details
Closed on
Jan 5, 2005
Sold by
File Roger and File Mary R
Bought by
File Richard E
Current Estimated Value
Purchase Details
Closed on
Mar 28, 2003
Sold by
Cline Mary and Cline Mary L
Bought by
File Richard E and Thornell Victoria
Home Financials for this Owner
Home Financials are based on the most recent Mortgage that was taken out on this home.
Original Mortgage
$111,000
Outstanding Balance
$48,350
Interest Rate
5.94%
Mortgage Type
Purchase Money Mortgage
Estimated Equity
$284,481
Purchase Details
Closed on
Dec 3, 2001
Sold by
The Mary L Cline Revocable Trust
Bought by
Cline Mary and Cline Mary L
Home Financials for this Owner
Home Financials are based on the most recent Mortgage that was taken out on this home.
Original Mortgage
$87,000
Interest Rate
7.07%
Purchase Details
Closed on
Dec 6, 1999
Sold by
Cline Mary L and Cline Jerold F
Bought by
Mary L Cline Revocable Trust
Create a Home Valuation Report for This Property
The Home Valuation Report is an in-depth analysis detailing your home's value as well as a comparison with similar homes in the area
Home Values in the Area
Average Home Value in this Area
Purchase History
| Date | Buyer | Sale Price | Title Company |
|---|---|---|---|
| File Richard E | -- | Chicago | |
| File Richard E | $151,000 | Devon Title Agency | |
| Cline Mary | -- | Chicago Title Of Michigan In | |
| Mary L Cline Revocable Trust | -- | -- | |
| Cline Mary Revoc Trust | -- | -- |
Source: Public Records
Mortgage History
| Date | Status | Borrower | Loan Amount |
|---|---|---|---|
| Open | File Richard E | $111,000 | |
| Previous Owner | Cline Mary | $87,000 | |
| Closed | File Richard E | $24,000 |
Source: Public Records
Tax History
| Year | Tax Paid | Tax Assessment Tax Assessment Total Assessment is a certain percentage of the fair market value that is determined by local assessors to be the total taxable value of land and additions on the property. | Land | Improvement |
|---|---|---|---|---|
| 2025 | $2,990 | $107,700 | $19,500 | $88,200 |
| 2024 | $2,726 | $94,100 | $14,200 | $79,900 |
| 2023 | $2,769 | $87,400 | $13,300 | $74,100 |
| 2022 | $2,726 | $79,400 | $8,200 | $71,200 |
| 2020 | $2,548 | $86,000 | $7,400 | $78,600 |
| 2019 | $0 | $83,800 | $7,400 | $76,400 |
| 2018 | $0 | $81,500 | $7,400 | $74,100 |
| 2017 | $0 | $82,000 | $7,400 | $74,600 |
| 2016 | $0 | $77,000 | $7,400 | $69,600 |
| 2015 | -- | $77,000 | $7,400 | $69,600 |
| 2014 | -- | $77,000 | $7,400 | $69,600 |
| 2013 | -- | $72,500 | $7,400 | $65,100 |
Source: Public Records
Map
Nearby Homes
- 715 Sycamore Bend
- 715 Sycamore Bn
- 12815 Sycamore Bend
- 9 Sycamore Bend
- 721 Sycamore Bend
- 711 Sycamore Bend
- 713 Sycamore Bend
- 720 Sycamore Bend
- 716 Sycamore Bend
- 720 W Gun River Dr
- 710 Sycamore Bn
- 725 Sycamore Bend
- 726 Sycamore Bend
- 720 W Gun River Dr
- 710 Sycamore Bend
- 707 Sycamore Bend
- 1073 107th Ave
- 1057 107th Ave
- 1073 106th Ave
- 726 Sycamore Bn
Your Personal Tour Guide
Ask me questions while you tour the home.