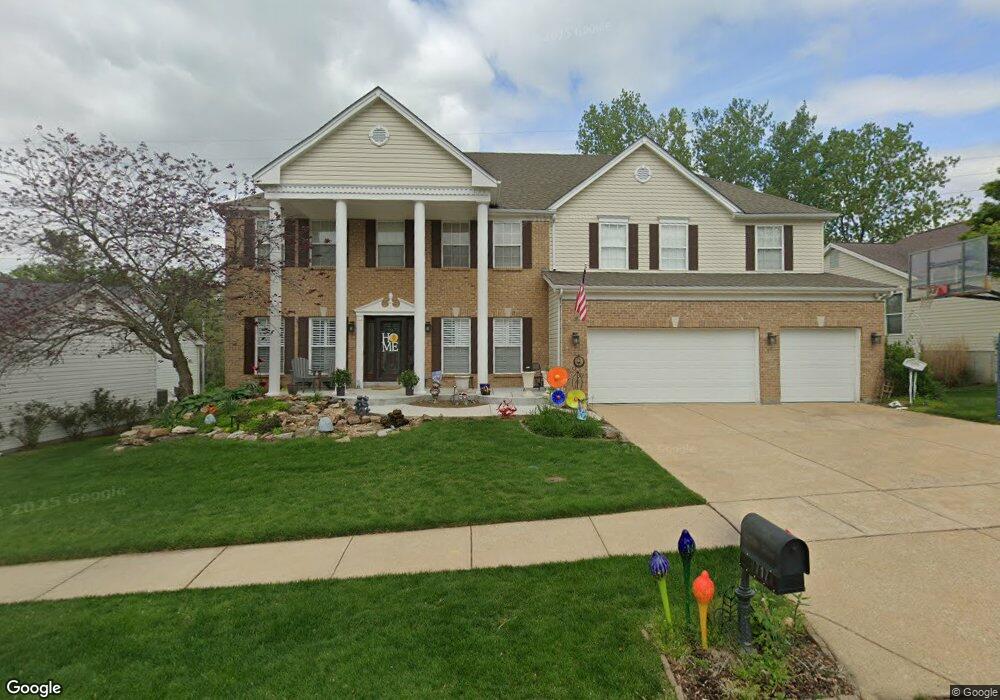
717 Turrentine Trail Saint Louis, MO 63141
Estimated Value: $800,000 - $965,232
4
Beds
5
Baths
5,704
Sq Ft
$150/Sq Ft
Est. Value
About This Home
This home is located at 717 Turrentine Trail, Saint Louis, MO 63141 and is currently estimated at $856,308, approximately $150 per square foot. 717 Turrentine Trail is a home located in St. Louis County with nearby schools including Bellerive Elementary School, Parkway Northeast Middle School, and Parkway North High School.
Ownership History
Date
Name
Owned For
Owner Type
Purchase Details
Closed on
Sep 30, 2015
Sold by
Guller Keith B and Guller Cynthia L
Bought by
Guller Keith B
Current Estimated Value
Home Financials for this Owner
Home Financials are based on the most recent Mortgage that was taken out on this home.
Original Mortgage
$399,999
Outstanding Balance
$154,282
Interest Rate
3.08%
Mortgage Type
New Conventional
Estimated Equity
$702,026
Purchase Details
Closed on
Jul 28, 2009
Sold by
Guller Keith B and Guller Cindi L
Bought by
Guller Keith B
Purchase Details
Closed on
Jun 21, 1999
Sold by
Taylor Morley Co
Bought by
Guller Keith B and Guller Cindi L
Home Financials for this Owner
Home Financials are based on the most recent Mortgage that was taken out on this home.
Original Mortgage
$318,590
Interest Rate
7.11%
Create a Home Valuation Report for This Property
The Home Valuation Report is an in-depth analysis detailing your home's value as well as a comparison with similar homes in the area
Home Values in the Area
Average Home Value in this Area
Purchase History
| Date | Buyer | Sale Price | Title Company |
|---|---|---|---|
| Guller Keith B | -- | Clear Title Inc | |
| Guller Keith B | -- | Clear Title Inc | |
| Guller Keith B | -- | None Available | |
| Guller Keith B | $358,237 | -- |
Source: Public Records
Mortgage History
| Date | Status | Borrower | Loan Amount |
|---|---|---|---|
| Open | Guller Keith B | $399,999 | |
| Closed | Guller Keith B | $318,590 |
Source: Public Records
Tax History Compared to Growth
Tax History
| Year | Tax Paid | Tax Assessment Tax Assessment Total Assessment is a certain percentage of the fair market value that is determined by local assessors to be the total taxable value of land and additions on the property. | Land | Improvement |
|---|---|---|---|---|
| 2025 | $8,978 | $143,790 | $32,490 | $111,300 |
| 2024 | $8,978 | $133,000 | $18,050 | $114,950 |
| 2023 | $8,618 | $133,000 | $18,050 | $114,950 |
| 2022 | $8,077 | $113,570 | $16,250 | $97,320 |
| 2021 | $8,029 | $113,570 | $16,250 | $97,320 |
| 2020 | $8,248 | $111,900 | $16,250 | $95,650 |
| 2019 | $8,071 | $111,900 | $16,250 | $95,650 |
| 2018 | $7,536 | $96,920 | $16,250 | $80,670 |
| 2017 | $7,315 | $96,920 | $16,250 | $80,670 |
| 2016 | $7,333 | $93,330 | $13,530 | $79,800 |
| 2015 | $7,685 | $93,330 | $13,530 | $79,800 |
| 2014 | $7,133 | $93,020 | $19,510 | $73,510 |
Source: Public Records
Map
Nearby Homes
- 13232 Dartagnan Ct
- 809 Aramis Dr
- 857 Coalport Dr
- 13417 Forestlac Dr
- 770 Montmartre Dr
- 13312 Wood Chapel Dr
- 13314 Wood Chapel Dr
- 29 Muirfield Ln
- 1121 Matador Dr Unit 1
- 13430 Manorlac Dr
- 13449 Manorlac Dr Unit 9D
- 13489 Beaulac Dr
- 12910 Chaumont Ct
- 13209 Matador Dr Unit 3
- 815 Ariege Dr
- 1163 Mill Crossing Dr Unit 103
- 56 Forest Crest Dr
- 1202 Creve Coeur Crossing Ln Unit G
- 12936 Bellerive Estates Dr
- 12932 Nimes Dr
- 721 Turrentine Trail
- 727 Turrentine Trail
- 709 Turrentine Trail
- 720 Turrentine Trail
- 716 Turrentine Trail
- 724 Turrentine Trail
- 729 Turrentine Trail
- 13249 Dartagnan Ct
- 728 Turrentine Trail
- 705 Turrentine Trail
- 732 Turrentine Trail
- 733 Turrentine Trail
- 715 Bellerive Manor Dr
- 13241 Dartagnan Ct
- 721 Bellerive Manor Dr
- 709 Bellerive Manor Dr
- 701 Turrentine Trail
- 727 Bellerive Manor Dr