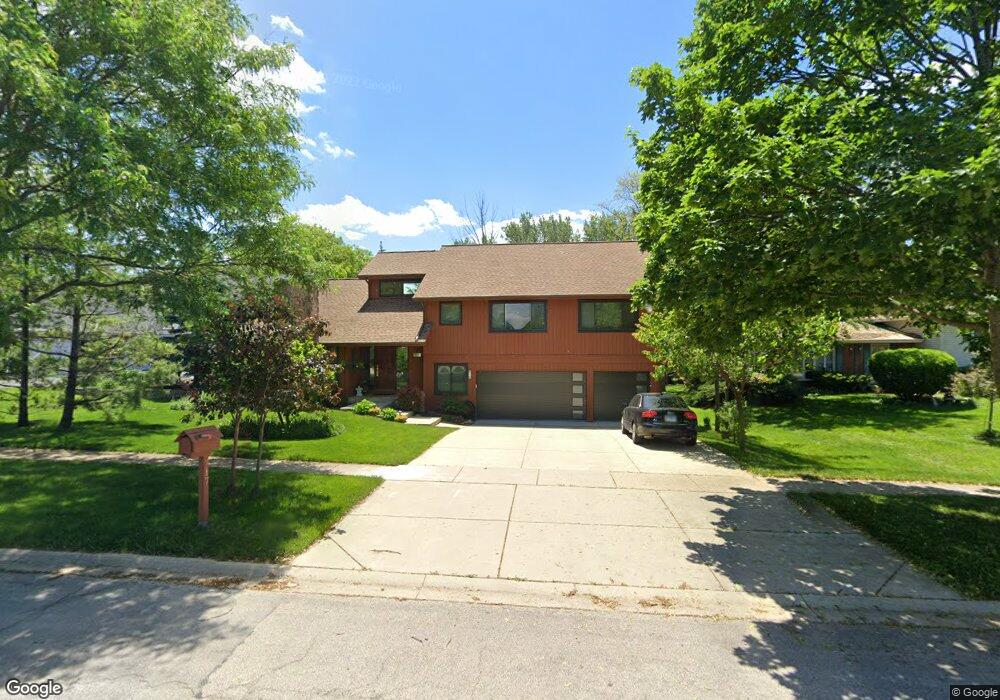
717 W Gilbert Rd Palatine, IL 60067
Plum Grove Village NeighborhoodEstimated Value: $687,000 - $756,000
4
Beds
3
Baths
2,424
Sq Ft
$297/Sq Ft
Est. Value
About This Home
This home is located at 717 W Gilbert Rd, Palatine, IL 60067 and is currently estimated at $718,758, approximately $296 per square foot. 717 W Gilbert Rd is a home located in Cook County with nearby schools including Pleasant Hill Elementary School, Plum Grove Jr High School, and William Fremd High School.
Ownership History
Date
Name
Owned For
Owner Type
Purchase Details
Closed on
Jun 23, 2004
Sold by
Jung John Y and Jung Julia S
Bought by
Maj Maciej and Maj Anna
Current Estimated Value
Home Financials for this Owner
Home Financials are based on the most recent Mortgage that was taken out on this home.
Original Mortgage
$448,000
Outstanding Balance
$206,879
Interest Rate
5.5%
Mortgage Type
Unknown
Estimated Equity
$511,879
Purchase Details
Closed on
Aug 29, 1996
Sold by
Saunders Robert and Saunders Mary D
Bought by
Jung John Y and Jung Julia S
Home Financials for this Owner
Home Financials are based on the most recent Mortgage that was taken out on this home.
Original Mortgage
$237,600
Interest Rate
8.3%
Create a Home Valuation Report for This Property
The Home Valuation Report is an in-depth analysis detailing your home's value as well as a comparison with similar homes in the area
Home Values in the Area
Average Home Value in this Area
Purchase History
| Date | Buyer | Sale Price | Title Company |
|---|---|---|---|
| Maj Maciej | $560,000 | Rtc | |
| Jung John Y | $297,000 | 1St American Title |
Source: Public Records
Mortgage History
| Date | Status | Borrower | Loan Amount |
|---|---|---|---|
| Open | Maj Maciej | $448,000 | |
| Previous Owner | Jung John Y | $237,600 |
Source: Public Records
Tax History
| Year | Tax Paid | Tax Assessment Tax Assessment Total Assessment is a certain percentage of the fair market value that is determined by local assessors to be the total taxable value of land and additions on the property. | Land | Improvement |
|---|---|---|---|---|
| 2025 | $13,820 | $69,000 | $28,488 | $40,512 |
| 2024 | $13,820 | $49,998 | $24,998 | $25,000 |
| 2023 | $13,340 | $49,998 | $24,998 | $25,000 |
| 2022 | $13,340 | $49,998 | $24,998 | $25,000 |
| 2021 | $13,467 | $44,796 | $14,837 | $29,959 |
| 2020 | $13,339 | $44,796 | $14,837 | $29,959 |
| 2019 | $13,260 | $49,664 | $14,837 | $34,827 |
| 2018 | $14,618 | $50,475 | $13,650 | $36,825 |
| 2017 | $14,360 | $50,475 | $13,650 | $36,825 |
| 2016 | $13,604 | $50,475 | $13,650 | $36,825 |
| 2015 | $13,448 | $46,393 | $12,463 | $33,930 |
| 2014 | $13,301 | $46,393 | $12,463 | $33,930 |
| 2013 | $12,943 | $46,393 | $12,463 | $33,930 |
Source: Public Records
Map
Nearby Homes
- 458 S Burno Dr
- Lot 2, Nessie's Grov Aldridge Ave
- 224, 228 E Rimini Ct
- 840 W Partridge Dr Unit C19
- 278 W Illinois Ave
- 537 W Parkside Dr Unit 18A2
- 709 W Glencoe Rd
- 1110 S Plum Tree Ln
- 950 W Hillside St
- 1224 W Whytecliff Rd
- 122 W Helen Rd
- 724 S Plum Grove Rd
- 439 S Bothwell St
- 1125 W Skylark Dr
- 712-724 S Plum Grove Rd
- 209 W Johnson St Unit 1B
- 1358 W Borders Dr
- 876 S Plum Grove Rd Unit 208
- 546 W Bridge View Ct
- 1250 S Falcon Dr
- 721 W Gilbert Rd
- 723 W Gilbert Rd
- 711 W Gilbert Rd
- 542 S Echo Ln
- 540 S Echo Ln
- 706 W Longview Ln
- 546 S Echo Ln
- 725 W Gilbert Rd
- 724 W Gilbert Rd
- 712 W Longview Ln
- 548 S Echo Ln
- 726 W Gilbert Rd
- 727 W Gilbert Rd
- 652 W Longview Ln
- 660 W Longview Ln
- 644 W Longview Ln
- 718 W Longview Ln
- 638 W Longview Ln
- 550 S Echo Ln
- 728 W Gilbert Rd
Your Personal Tour Guide
Ask me questions while you tour the home.