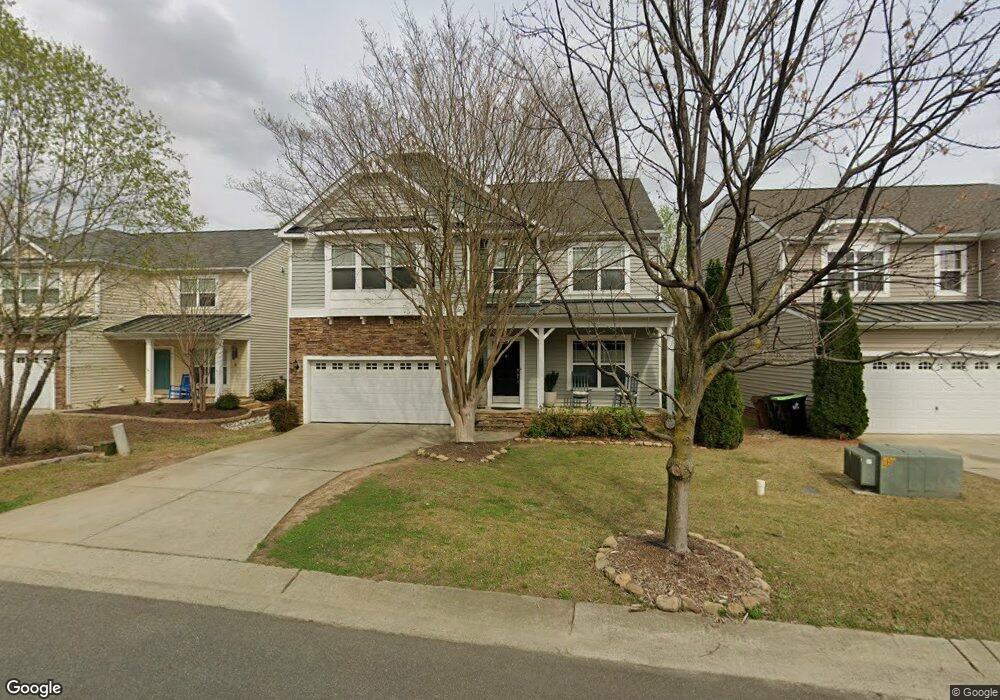
717 Wellspring Dr Holly Springs, NC 27540
Estimated Value: $485,000 - $515,000
3
Beds
3
Baths
2,391
Sq Ft
$211/Sq Ft
Est. Value
About This Home
This home is located at 717 Wellspring Dr, Holly Springs, NC 27540 and is currently estimated at $504,077, approximately $210 per square foot. 717 Wellspring Dr is a home located in Wake County with nearby schools including Holly Springs Elementary School, Holly Ridge Middle School, and Apex Friendship High School.
Ownership History
Date
Name
Owned For
Owner Type
Purchase Details
Closed on
Dec 10, 2020
Sold by
Brown William M and Brown Hope M
Bought by
Patil Vinod S and Lalwani Bhavana V
Current Estimated Value
Home Financials for this Owner
Home Financials are based on the most recent Mortgage that was taken out on this home.
Original Mortgage
$314,109
Outstanding Balance
$279,651
Interest Rate
2.7%
Mortgage Type
New Conventional
Estimated Equity
$224,426
Purchase Details
Closed on
Feb 25, 2019
Sold by
Curler Brian A and Curler Kimberly Anne
Bought by
Brown William M and Brown Hope M
Purchase Details
Closed on
Jul 1, 2008
Sold by
Anderson Homes Inc
Bought by
Curler Brian A and Bogan Kimberly Anne
Home Financials for this Owner
Home Financials are based on the most recent Mortgage that was taken out on this home.
Original Mortgage
$94,690
Interest Rate
5.99%
Mortgage Type
Purchase Money Mortgage
Purchase Details
Closed on
Mar 31, 2008
Sold by
Bridgewater Land Resource Llc
Bought by
Anderson Homes Inc
Create a Home Valuation Report for This Property
The Home Valuation Report is an in-depth analysis detailing your home's value as well as a comparison with similar homes in the area
Home Values in the Area
Average Home Value in this Area
Purchase History
| Date | Buyer | Sale Price | Title Company |
|---|---|---|---|
| Patil Vinod S | $346,000 | None Available | |
| Brown William M | $307,500 | None Available | |
| Curler Brian A | $270,000 | None Available | |
| Anderson Homes Inc | $234,000 | None Available |
Source: Public Records
Mortgage History
| Date | Status | Borrower | Loan Amount |
|---|---|---|---|
| Open | Patil Vinod S | $314,109 | |
| Previous Owner | Curler Brian A | $94,690 |
Source: Public Records
Tax History Compared to Growth
Tax History
| Year | Tax Paid | Tax Assessment Tax Assessment Total Assessment is a certain percentage of the fair market value that is determined by local assessors to be the total taxable value of land and additions on the property. | Land | Improvement |
|---|---|---|---|---|
| 2025 | $4,235 | $489,732 | $120,000 | $369,732 |
| 2024 | $4,217 | $489,732 | $120,000 | $369,732 |
| 2023 | $3,317 | $305,658 | $55,000 | $250,658 |
| 2022 | $3,202 | $305,658 | $55,000 | $250,658 |
| 2021 | $3,143 | $305,658 | $55,000 | $250,658 |
| 2020 | $3,143 | $305,658 | $55,000 | $250,658 |
| 2019 | $3,069 | $253,434 | $50,000 | $203,434 |
| 2018 | $0 | $253,434 | $50,000 | $203,434 |
| 2017 | $2,675 | $253,434 | $50,000 | $203,434 |
| 2016 | $2,638 | $253,434 | $50,000 | $203,434 |
| 2015 | $2,584 | $244,350 | $42,000 | $202,350 |
| 2014 | $2,495 | $244,350 | $42,000 | $202,350 |
Source: Public Records
Map
Nearby Homes
- 116 Cobblebrook Ct
- 208 Apple Drupe Way
- 204 Leafgate Ct
- 201 Holmby Ct
- 5620 Lockley Rd
- 213 Capello Ct
- 425 Arbor Creek Dr
- 112 Fairford Dr
- 138 Cobalt Creek Way
- 112 Sanchez Ct
- 109 Willow View Ln
- 300 Firefly Rd
- 1539 N Main St
- 148 Danesway Dr
- 127 Willow View Ln
- 317 Commons Dr
- 204 Chrismill Ln
- 225 Hazelmere Dr
- 201 Mayfield Dr
- 5325 Dutch Elm Dr
- 721 Wellspring Dr
- 713 Wellspring Dr
- 709 Wellspring Dr
- 705 Wellspring Dr
- 716 Wellspring Dr
- 712 Wellsprings Dr
- 720 Wellspring Dr
- 708 Wellspring Dr
- 704 Wellspring Dr
- 701 Wellspring Dr
- 701 Anchor Creek Way
- 613 Anchor Creek Way
- 100 Cobblebrook Ct
- 109 Boatdock Dr
- 617 Wellspring Dr
- 105 Boatdock Dr
- 101 Boatdock Dr
- 609 Anchor Creek Way
- 104 Cobblebrook Ct
- 613 Wellspring Dr