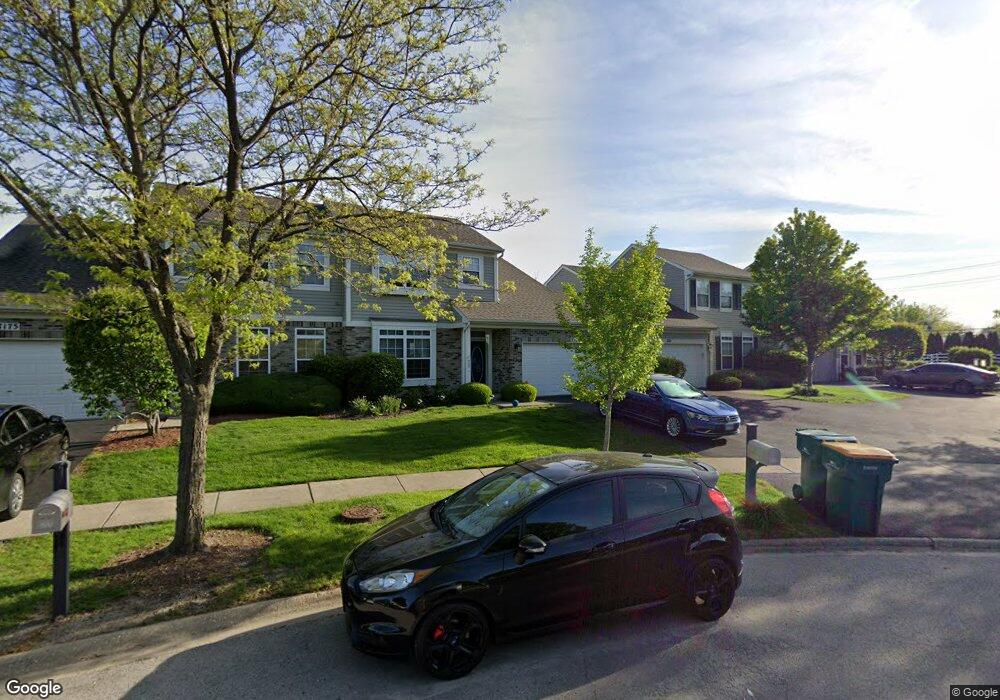
7173 Bradley Dr Unit 1 Plainfield, IL 60586
North Minooka NeighborhoodEstimated Value: $253,000 - $281,000
Studio
1
Bath
1,252
Sq Ft
$214/Sq Ft
Est. Value
About This Home
This home is located at 7173 Bradley Dr Unit 1, Plainfield, IL 60586 and is currently estimated at $268,189, approximately $214 per square foot. 7173 Bradley Dr Unit 1 is a home located in Kendall County with nearby schools including Charles Reed Elementary School, Drauden Point Middle School, and Plainfield South High School.
Ownership History
Date
Name
Owned For
Owner Type
Purchase Details
Closed on
Jun 13, 2013
Sold by
Kriz Christopher and Kriz Christopher J
Bought by
Kriz Christopher and Kriz Margarita
Current Estimated Value
Home Financials for this Owner
Home Financials are based on the most recent Mortgage that was taken out on this home.
Original Mortgage
$120,487
Outstanding Balance
$56,846
Interest Rate
3.5%
Mortgage Type
FHA
Estimated Equity
$211,343
Purchase Details
Closed on
Dec 27, 2002
Sold by
Bokhardt Thomas A and Bokhardt Alaine L
Bought by
Margaret M Poley Trust
Purchase Details
Closed on
Apr 25, 2000
Sold by
Richard Smykal Inc
Bought by
Eckhardt Thomas A and Eckhardt Alaine L
Home Financials for this Owner
Home Financials are based on the most recent Mortgage that was taken out on this home.
Original Mortgage
$113,095
Interest Rate
8.24%
Mortgage Type
FHA
Create a Home Valuation Report for This Property
The Home Valuation Report is an in-depth analysis detailing your home's value as well as a comparison with similar homes in the area
Home Values in the Area
Average Home Value in this Area
Purchase History
| Date | Buyer | Sale Price | Title Company |
|---|---|---|---|
| Kriz Christopher | -- | Citywide Title Corporation | |
| Margaret M Poley Trust | $127,500 | Chicago Title Insurance Co | |
| Eckhardt Thomas A | $134,000 | Chicago Title Insurance Co |
Source: Public Records
Mortgage History
| Date | Status | Borrower | Loan Amount |
|---|---|---|---|
| Open | Kriz Christopher | $120,487 | |
| Previous Owner | Eckhardt Thomas A | $113,095 |
Source: Public Records
Tax History
| Year | Tax Paid | Tax Assessment Tax Assessment Total Assessment is a certain percentage of the fair market value that is determined by local assessors to be the total taxable value of land and additions on the property. | Land | Improvement |
|---|---|---|---|---|
| 2024 | $4,952 | $74,483 | $9,000 | $65,483 |
| 2023 | $3,900 | $63,294 | $5,000 | $58,294 |
| 2022 | $3,900 | $54,974 | $4,433 | $50,541 |
| 2021 | $3,641 | $50,737 | $4,133 | $46,604 |
| 2020 | $3,651 | $50,022 | $4,075 | $45,947 |
| 2019 | $3,464 | $47,066 | $3,834 | $43,232 |
| 2018 | $3,104 | $42,268 | $3,443 | $38,825 |
| 2017 | $3,063 | $39,988 | $3,257 | $36,731 |
| 2016 | $2,849 | $36,851 | $3,217 | $33,634 |
| 2015 | $2,980 | $36,687 | $3,053 | $33,634 |
| 2014 | -- | $29,538 | $3,053 | $26,485 |
| 2013 | -- | $29,538 | $3,053 | $26,485 |
Source: Public Records
Map
Nearby Homes
- 7221 Bradley Dr
- 2302 Covington Ct
- 2031 Havenhill Dr
- 2002 Havenhill Dr
- 2017 Lilyana Ln
- BELLAMY Plan at Ashford Place
- COVENTRY Plan at Ashford Place
- HENLEY Plan at Ashford Place
- HOLCOMBE Plan at Ashford Place
- HAVEN Plan at Ashford Place
- 2009 Ashbrook Ct Unit 3
- 7202 Faxton Ln
- 2404 White Ash Ct
- 6709 Buchanan Cir
- 6707 Buchanan Cir
- 6710 Buchanan Cir
- 6708 Buchanan Cir
- 6703 Buchanan Cir
- 6701 Buchanan Cir
- 6706 Buchanan Cir
- 7171 Bradley Dr
- 7175 Bradley Dr
- 7169 Bradley Dr Unit 1
- 7203 Bradley Dr
- 7144 Caton Farm Rd
- 2311 Bradley Dr
- 7142 Caton Farm Rd
- 7205 Bradley Dr
- 7205 Bradley Dr Unit 7205
- 2309 Bradley Dr
- 2309 Bradley Dr Unit 5
- 7200 Bradley Dr
- 7207 Bradley Dr
- 7202 Bradley Dr Unit 1
- 2307 Bradley Dr
- 7156 Caton Farm Rd
- 7204 Bradley Dr
- 7209 Bradley Dr
- 2305 Bradley Dr Unit 1
- 7201 Alden Dr
Your Personal Tour Guide
Ask me questions while you tour the home.