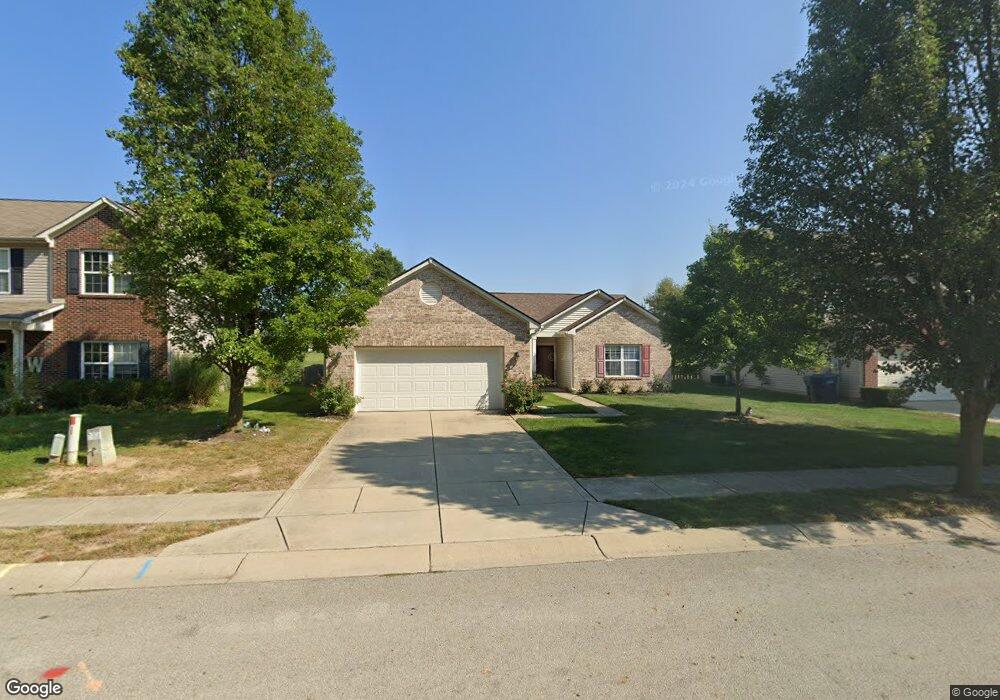
7178 Morello Ln Noblesville, IN 46062
West Noblesville NeighborhoodEstimated Value: $322,000 - $336,000
3
Beds
2
Baths
1,660
Sq Ft
$198/Sq Ft
Est. Value
About This Home
This home is located at 7178 Morello Ln, Noblesville, IN 46062 and is currently estimated at $329,017, approximately $198 per square foot. 7178 Morello Ln is a home located in Hamilton County with nearby schools including Noble Crossing Elementary School, Noblesville West Middle School, and Noblesville High School.
Ownership History
Date
Name
Owned For
Owner Type
Purchase Details
Closed on
Dec 28, 2010
Sold by
Leveridge Edward L and Leveridge Huong
Bought by
Leveridge Huong
Current Estimated Value
Home Financials for this Owner
Home Financials are based on the most recent Mortgage that was taken out on this home.
Original Mortgage
$50,000
Outstanding Balance
$33,529
Interest Rate
4.44%
Mortgage Type
New Conventional
Estimated Equity
$295,488
Purchase Details
Closed on
Jan 22, 2007
Sold by
Westport Homes Inc
Bought by
Daniels Ray J and Daniels Betty M
Home Financials for this Owner
Home Financials are based on the most recent Mortgage that was taken out on this home.
Original Mortgage
$56,325
Interest Rate
6.19%
Mortgage Type
Purchase Money Mortgage
Purchase Details
Closed on
Sep 12, 2006
Sold by
Triton Development Llc
Bought by
Westport Homes Inc
Purchase Details
Closed on
Oct 6, 2005
Sold by
Centex Homes
Bought by
Triton Development Llc
Create a Home Valuation Report for This Property
The Home Valuation Report is an in-depth analysis detailing your home's value as well as a comparison with similar homes in the area
Home Values in the Area
Average Home Value in this Area
Purchase History
| Date | Buyer | Sale Price | Title Company |
|---|---|---|---|
| Leveridge Huong | -- | None Available | |
| Leveridge Edward L | -- | None Available | |
| Daniels Ray J | -- | None Available | |
| Westport Homes Inc | -- | None Available | |
| Triton Development Llc | -- | -- |
Source: Public Records
Mortgage History
| Date | Status | Borrower | Loan Amount |
|---|---|---|---|
| Open | Leveridge Edward L | $50,000 | |
| Previous Owner | Daniels Ray J | $56,325 | |
| Closed | Westport Homes Inc | $0 |
Source: Public Records
Tax History Compared to Growth
Tax History
| Year | Tax Paid | Tax Assessment Tax Assessment Total Assessment is a certain percentage of the fair market value that is determined by local assessors to be the total taxable value of land and additions on the property. | Land | Improvement |
|---|---|---|---|---|
| 2024 | $3,158 | $271,600 | $55,000 | $216,600 |
| 2023 | $3,158 | $257,300 | $55,000 | $202,300 |
| 2022 | $2,896 | $228,000 | $55,000 | $173,000 |
| 2021 | $2,521 | $200,200 | $55,000 | $145,200 |
| 2020 | $2,337 | $181,700 | $55,000 | $126,700 |
| 2019 | $2,092 | $170,800 | $29,000 | $141,800 |
| 2018 | $1,977 | $158,600 | $29,000 | $129,600 |
| 2017 | $1,792 | $150,100 | $29,000 | $121,100 |
| 2016 | $1,652 | $141,400 | $29,000 | $112,400 |
| 2014 | $1,575 | $134,800 | $30,400 | $104,400 |
| 2013 | $1,575 | $131,400 | $30,500 | $100,900 |
Source: Public Records
Map
Nearby Homes
- 16924 Maraschino Dr
- 6421 Kilpatrick Ln
- 6445 Kilpatrick Ln
- 6397 Kilpatrick Ln
- 16747 Goodson Dr
- 6493 Kilpatrick Ln
- 6433 Kilpatrick Ln
- 17030 Daly Dr
- Wentworth Plan at Magnolia Ridge - Venture
- Rockwell Plan at Magnolia Ridge - Cornerstone
- Jasper Plan at Magnolia Ridge - Venture
- Fairmont Plan at Magnolia Ridge - Cornerstone
- Valencia Plan at Magnolia Ridge - Venture
- Seabrook Plan at Magnolia Ridge - Cornerstone
- Kingston Plan at Magnolia Ridge - Venture
- Hampshire Plan at Magnolia Ridge - Venture
- Paddington Plan at Magnolia Ridge - Venture
- 6460 Stokes Ave
- 16269 Magnolia Ridge Way
- 17466 Trailview Cir
- 7188 Morello Ln
- 7170 Morello Ln
- 7164 Morello Ln
- 7194 Morello Ln
- 7202 Morello Ln
- 7158 Morello Ln
- 7175 Morello Ln
- 7183 Morello Ln
- 7167 Morello Ln
- 7191 Morello Ln
- 7159 Morello Ln
- 7146 Morello Ln
- 7208 Morello Ln
- 7199 Morello Ln
- 7146 Moello Ln
- 7151 Morello Ln
- 7140 Morello Ln
- 7207 Morello Ln
- 7112 Morello Ln
- 7143 Morello Ln