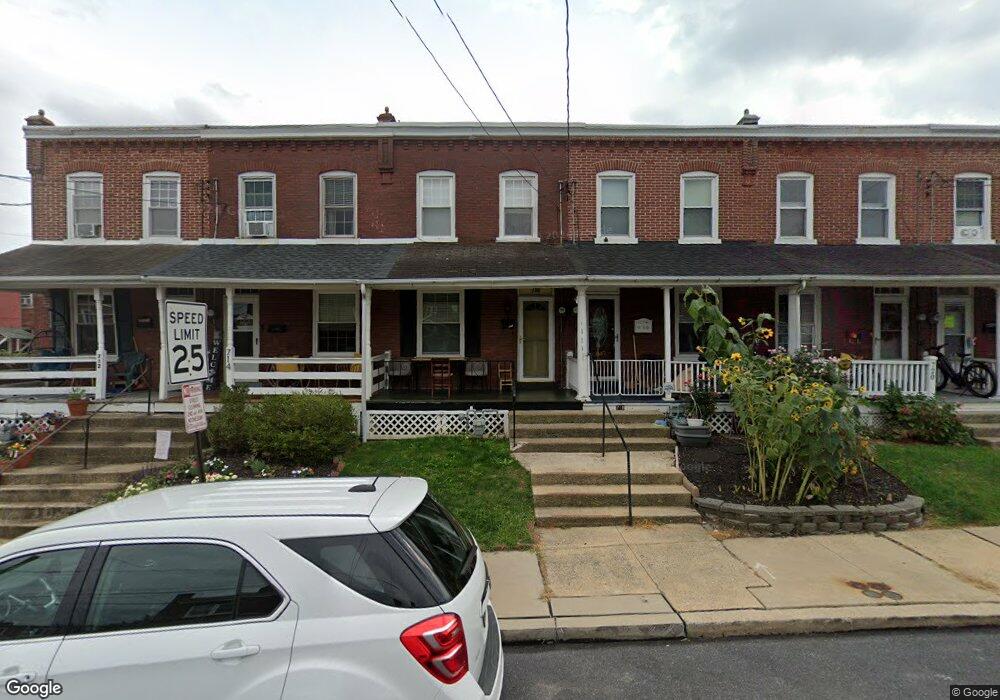
718 5th St Lancaster, PA 17603
West End NeighborhoodEstimated Value: $168,796 - $210,000
3
Beds
1
Bath
916
Sq Ft
$202/Sq Ft
Est. Value
About This Home
This home is located at 718 5th St, Lancaster, PA 17603 and is currently estimated at $185,199, approximately $202 per square foot. 718 5th St is a home located in Lancaster County with nearby schools including Smith-Wade-El Elementary School, Wheatland Middle School, and McCaskey High School.
Ownership History
Date
Name
Owned For
Owner Type
Purchase Details
Closed on
Jun 28, 2010
Sold by
Chamberlin John R and Chamberlin Corinne L
Bought by
Armer Michael N
Current Estimated Value
Home Financials for this Owner
Home Financials are based on the most recent Mortgage that was taken out on this home.
Original Mortgage
$85,843
Outstanding Balance
$57,470
Interest Rate
4.87%
Mortgage Type
FHA
Estimated Equity
$127,729
Purchase Details
Closed on
Feb 22, 2010
Sold by
Kopf Virginia M and Kopf Paul Richard
Bought by
Chamberlin John R
Home Financials for this Owner
Home Financials are based on the most recent Mortgage that was taken out on this home.
Original Mortgage
$32,000
Interest Rate
5.11%
Mortgage Type
New Conventional
Create a Home Valuation Report for This Property
The Home Valuation Report is an in-depth analysis detailing your home's value as well as a comparison with similar homes in the area
Home Values in the Area
Average Home Value in this Area
Purchase History
| Date | Buyer | Sale Price | Title Company |
|---|---|---|---|
| Armer Michael N | $87,000 | None Available | |
| Chamberlin John R | $40,000 | None Available |
Source: Public Records
Mortgage History
| Date | Status | Borrower | Loan Amount |
|---|---|---|---|
| Open | Armer Michael N | $85,843 | |
| Previous Owner | Chamberlin John R | $32,000 |
Source: Public Records
Tax History
| Year | Tax Paid | Tax Assessment Tax Assessment Total Assessment is a certain percentage of the fair market value that is determined by local assessors to be the total taxable value of land and additions on the property. | Land | Improvement |
|---|---|---|---|---|
| 2025 | $2,517 | $63,600 | $17,500 | $46,100 |
| 2024 | $2,517 | $63,600 | $17,500 | $46,100 |
| 2023 | $2,474 | $63,600 | $17,500 | $46,100 |
| 2022 | $2,371 | $63,600 | $17,500 | $46,100 |
| 2021 | $2,320 | $63,600 | $17,500 | $46,100 |
| 2020 | $2,320 | $63,600 | $17,500 | $46,100 |
| 2019 | $2,286 | $63,600 | $17,500 | $46,100 |
| 2018 | $2,663 | $63,600 | $17,500 | $46,100 |
| 2017 | $2,545 | $55,400 | $20,300 | $35,100 |
| 2016 | $2,521 | $55,400 | $20,300 | $35,100 |
| 2015 | $984 | $55,400 | $20,300 | $35,100 |
| 2014 | $1,773 | $55,400 | $20,300 | $35,100 |
Source: Public Records
Map
Nearby Homes
Your Personal Tour Guide
Ask me questions while you tour the home.