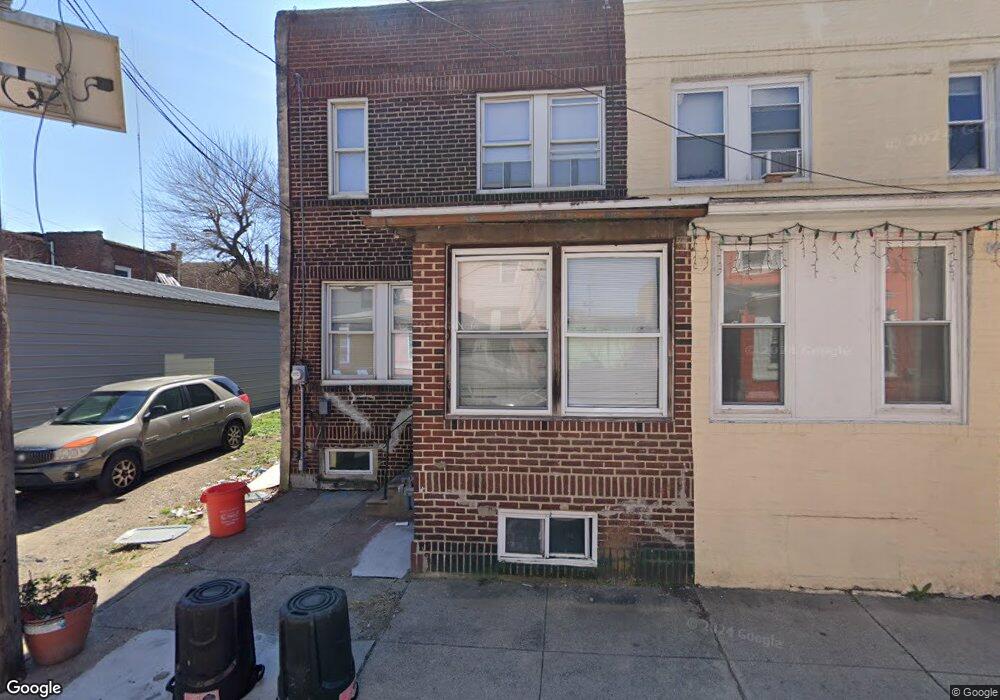
718 Bailey St Camden, NJ 08102
North Camden NeighborhoodEstimated Value: $119,000 - $178,000
3
Beds
1
Bath
1,152
Sq Ft
$130/Sq Ft
Est. Value
About This Home
This home is located at 718 Bailey St, Camden, NJ 08102 and is currently estimated at $149,421, approximately $129 per square foot. 718 Bailey St is a home located in Camden County with nearby schools including Eastside High School, Leap Academy University Charter School, and Holy Name School.
Ownership History
Date
Name
Owned For
Owner Type
Purchase Details
Closed on
Mar 25, 2005
Sold by
Nunez Robert
Bought by
Hernandez Becky
Current Estimated Value
Home Financials for this Owner
Home Financials are based on the most recent Mortgage that was taken out on this home.
Original Mortgage
$45,000
Outstanding Balance
$23,070
Interest Rate
5.78%
Estimated Equity
$126,351
Purchase Details
Closed on
Jul 20, 2004
Sold by
Plummer Mildred
Bought by
Nunez Robert
Create a Home Valuation Report for This Property
The Home Valuation Report is an in-depth analysis detailing your home's value as well as a comparison with similar homes in the area
Home Values in the Area
Average Home Value in this Area
Purchase History
| Date | Buyer | Sale Price | Title Company |
|---|---|---|---|
| Hernandez Becky | $45,000 | -- | |
| Nunez Robert | $8,000 | -- |
Source: Public Records
Mortgage History
| Date | Status | Borrower | Loan Amount |
|---|---|---|---|
| Open | Hernandez Becky | $45,000 |
Source: Public Records
Tax History Compared to Growth
Tax History
| Year | Tax Paid | Tax Assessment Tax Assessment Total Assessment is a certain percentage of the fair market value that is determined by local assessors to be the total taxable value of land and additions on the property. | Land | Improvement |
|---|---|---|---|---|
| 2025 | $1,676 | $47,300 | $6,500 | $40,800 |
| 2024 | $1,620 | $47,300 | $6,500 | $40,800 |
| 2023 | $1,620 | $47,300 | $6,500 | $40,800 |
| 2022 | $1,590 | $47,300 | $6,500 | $40,800 |
| 2021 | $1,582 | $47,300 | $6,500 | $40,800 |
| 2020 | $1,504 | $47,300 | $6,500 | $40,800 |
| 2019 | $1,440 | $47,300 | $6,500 | $40,800 |
| 2018 | $1,433 | $47,300 | $6,500 | $40,800 |
| 2017 | $1,398 | $47,300 | $6,500 | $40,800 |
| 2016 | $1,353 | $47,300 | $6,500 | $40,800 |
| 2015 | $1,303 | $47,300 | $6,500 | $40,800 |
| 2014 | $1,271 | $47,300 | $6,500 | $40,800 |
Source: Public Records
Map
Nearby Homes