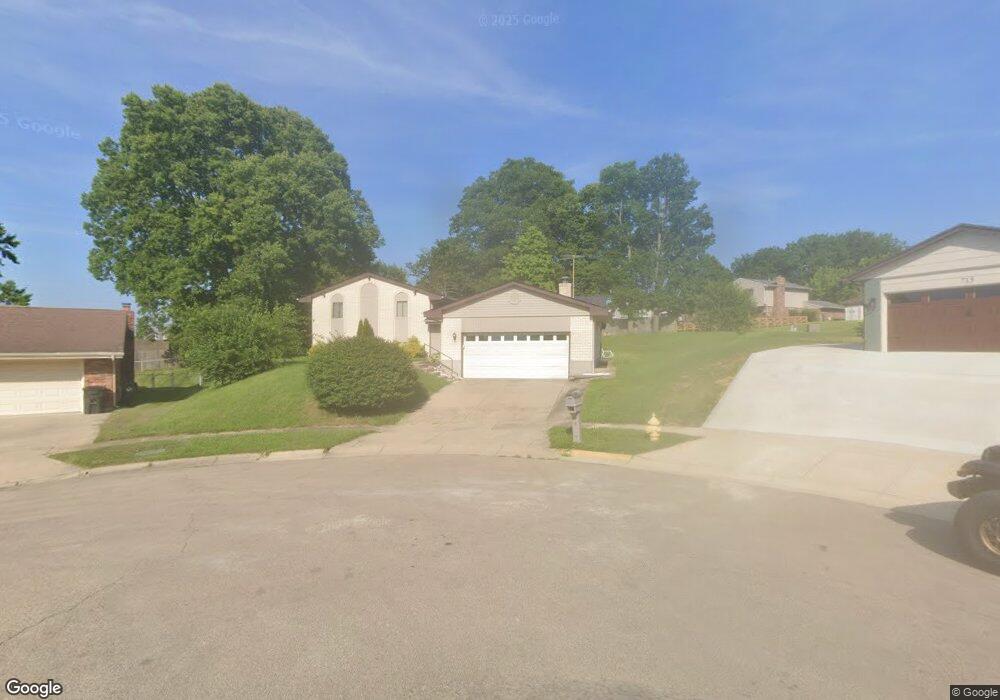
718 Blackmoat Place Miamisburg, OH 45342
Estimated Value: $305,000 - $323,000
3
Beds
3
Baths
2,621
Sq Ft
$120/Sq Ft
Est. Value
About This Home
This home is located at 718 Blackmoat Place, Miamisburg, OH 45342 and is currently estimated at $315,101, approximately $120 per square foot. 718 Blackmoat Place is a home located in Montgomery County with nearby schools including Miamisburg High School and Bethel Baptist School.
Ownership History
Date
Name
Owned For
Owner Type
Purchase Details
Closed on
Jan 11, 2021
Sold by
Robertson Jonathan B and Cavagnaro Leah
Bought by
Lomonaco Eric
Current Estimated Value
Home Financials for this Owner
Home Financials are based on the most recent Mortgage that was taken out on this home.
Original Mortgage
$182,400
Outstanding Balance
$162,764
Interest Rate
2.7%
Mortgage Type
New Conventional
Estimated Equity
$152,337
Purchase Details
Closed on
May 1, 2015
Sold by
Parson Kevin Dale
Bought by
Robertson Jonathan D
Home Financials for this Owner
Home Financials are based on the most recent Mortgage that was taken out on this home.
Original Mortgage
$130,591
Interest Rate
4.12%
Mortgage Type
FHA
Purchase Details
Closed on
May 17, 2000
Sold by
Estate Of Virginia Opal Martin
Bought by
Martin Elinor Florence
Purchase Details
Closed on
Aug 17, 1996
Sold by
Parson Rose Marie
Bought by
Parson Rose Marie
Create a Home Valuation Report for This Property
The Home Valuation Report is an in-depth analysis detailing your home's value as well as a comparison with similar homes in the area
Home Values in the Area
Average Home Value in this Area
Purchase History
| Date | Buyer | Sale Price | Title Company |
|---|---|---|---|
| Lomonaco Eric | $228,000 | Pctitle Pros | |
| Robertson Jonathan D | $133,000 | 360 American Title Services | |
| Martin Elinor Florence | -- | -- | |
| Parson Rose Marie | -- | -- |
Source: Public Records
Mortgage History
| Date | Status | Borrower | Loan Amount |
|---|---|---|---|
| Open | Lomonaco Eric | $182,400 | |
| Previous Owner | Robertson Jonathan D | $130,591 |
Source: Public Records
Tax History Compared to Growth
Tax History
| Year | Tax Paid | Tax Assessment Tax Assessment Total Assessment is a certain percentage of the fair market value that is determined by local assessors to be the total taxable value of land and additions on the property. | Land | Improvement |
|---|---|---|---|---|
| 2024 | $5,006 | $78,900 | $14,490 | $64,410 |
| 2023 | $5,006 | $78,900 | $14,490 | $64,410 |
| 2022 | $4,949 | $65,760 | $12,080 | $53,680 |
| 2021 | $4,377 | $65,760 | $12,080 | $53,680 |
| 2020 | $4,369 | $65,760 | $12,080 | $53,680 |
| 2019 | $3,847 | $53,120 | $10,500 | $42,620 |
| 2018 | $3,860 | $53,120 | $10,500 | $42,620 |
| 2017 | $3,833 | $53,120 | $10,500 | $42,620 |
| 2016 | $3,533 | $47,170 | $10,500 | $36,670 |
| 2015 | $3,464 | $47,170 | $10,500 | $36,670 |
| 2014 | $3,464 | $47,170 | $10,500 | $36,670 |
| 2012 | -- | $54,370 | $15,960 | $38,410 |
Source: Public Records
Map
Nearby Homes
- 2302 King Richard Pkwy
- 838 Maid Marion Ct
- 2061 Pine Forest Dr
- 700 N Gebhart Church Rd
- 2125 Sherwood Forest Dr
- 524 N Lindsey Ave
- 703 Friar Tuck Ct
- 516 N Lindsey Ave
- 609 Kings Cross Ct
- 514 N Lindsey Ave
- 1100 S Elm St
- 1803 Cudgell Dr
- 2090 E Central Ave
- 500 Lincoln Green Dr
- 857 Lea Castle Place
- 432 Crusader Dr
- 1678 Carolyn Dr
- 1642 Carolyn Dr
- 429 Wilson Park Dr
- 1153 King Richard Pkwy
- 720 Blackmoat Place
- 715 Blackmoat Place
- 715 Helmet Place
- 2349 Oakbark St
- 2345 Oakbark St
- 722 Blackmoat Place
- 2341 Oakbark St
- 2353 Oakbark St
- 717 Helmet Place
- 717 Blackmoat Place
- 719 Blackmoat Place
- 718 Helmet Place
- 2339 Oakbark St
- 721 Blackmoat Place
- 2357 Oakbark St
- 724 Blackmoat Place
- 2333 Oakbark St
- 719 Helmet Place
- 2324 King Richard Pkwy
- 728 Helmet Place