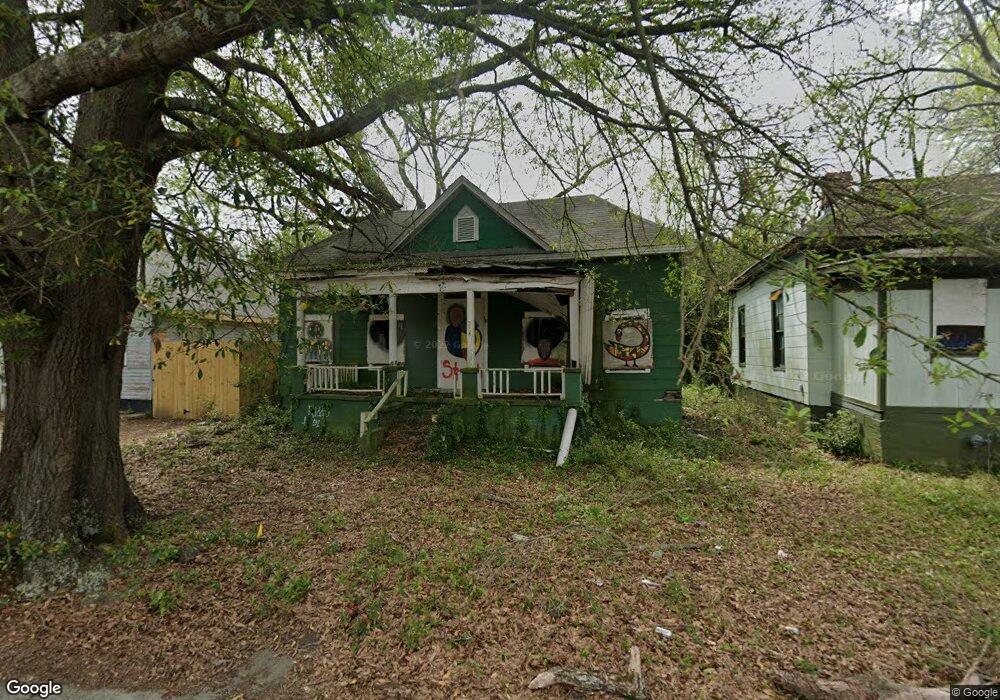
718 Bowden St Macon, GA 31201
Tindall Heights Historic District NeighborhoodEstimated Value: $44,000 - $66,000
2
Beds
1
Bath
1,080
Sq Ft
$51/Sq Ft
Est. Value
About This Home
This home is located at 718 Bowden St, Macon, GA 31201 and is currently estimated at $54,982, approximately $50 per square foot. 718 Bowden St is a home located in Bibb County with nearby schools including Ingram-Pye Elementary School, Central High School, and Cirrus Charter Academy.
Ownership History
Date
Name
Owned For
Owner Type
Purchase Details
Closed on
Feb 14, 2023
Sold by
Macon-Bibb County Land Bank Authority
Bought by
Emilien Daniella
Current Estimated Value
Purchase Details
Closed on
Dec 14, 2022
Sold by
Tax Commissioner Of Macon-Bibb County
Bought by
Land Bank Authority
Purchase Details
Closed on
Aug 21, 2006
Sold by
J K Procurment Cleaing Services Inc
Bought by
Kabuye Flex
Purchase Details
Closed on
Jun 6, 2006
Sold by
Jpmorgan Chase Bank
Bought by
Jp Morgan Chase Bank
Purchase Details
Closed on
Dec 6, 2005
Create a Home Valuation Report for This Property
The Home Valuation Report is an in-depth analysis detailing your home's value as well as a comparison with similar homes in the area
Home Values in the Area
Average Home Value in this Area
Purchase History
| Date | Buyer | Sale Price | Title Company |
|---|---|---|---|
| Emilien Daniella | $3,000 | -- | |
| Land Bank Authority | $12,753 | -- | |
| Kabuye Flex | -- | None Available | |
| Jp Morgan Chase Bank | $7,500 | None Avelable | |
| -- | $18,600 | -- |
Source: Public Records
Tax History
| Year | Tax Paid | Tax Assessment Tax Assessment Total Assessment is a certain percentage of the fair market value that is determined by local assessors to be the total taxable value of land and additions on the property. | Land | Improvement |
|---|---|---|---|---|
| 2025 | $462 | $18,799 | $1,840 | $16,959 |
| 2024 | $477 | $18,799 | $1,840 | $16,959 |
| 2023 | $0 | $17,144 | $1,840 | $15,304 |
| 2022 | $1,843 | $12,974 | $1,840 | $11,134 |
| 2021 | $493 | $12,974 | $1,840 | $11,134 |
| 2020 | $504 | $12,974 | $1,840 | $11,134 |
| 2019 | $508 | $12,974 | $1,840 | $11,134 |
| 2018 | $958 | $12,974 | $1,840 | $11,134 |
| 2017 | $486 | $12,974 | $1,840 | $11,134 |
| 2016 | $449 | $12,974 | $1,840 | $11,134 |
| 2015 | $635 | $12,974 | $1,840 | $11,134 |
| 2014 | $731 | $12,974 | $1,840 | $11,134 |
Source: Public Records
Map
Nearby Homes
Your Personal Tour Guide
Ask me questions while you tour the home.