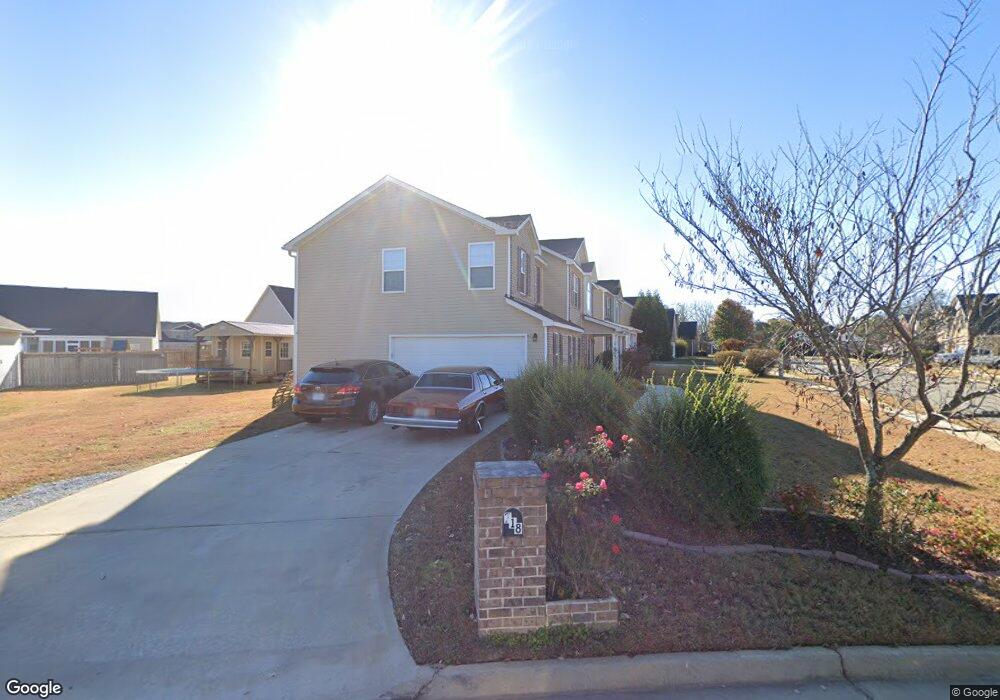
718 Broderick Cir Warner Robins, GA 31088
Estimated Value: $284,000 - $371,000
4
Beds
3
Baths
2,623
Sq Ft
$125/Sq Ft
Est. Value
About This Home
This home is located at 718 Broderick Cir, Warner Robins, GA 31088 and is currently estimated at $328,768, approximately $125 per square foot. 718 Broderick Cir is a home located in Houston County with nearby schools including David A. Perdue Primary School, David A. Perdue Elementary School, and Feagin Mill Middle School.
Ownership History
Date
Name
Owned For
Owner Type
Purchase Details
Closed on
Jul 31, 2009
Sold by
Ross Eric L
Bought by
Ross Eric L and Ross Olivia Alexandria
Current Estimated Value
Home Financials for this Owner
Home Financials are based on the most recent Mortgage that was taken out on this home.
Original Mortgage
$168,565
Outstanding Balance
$111,240
Interest Rate
5.53%
Mortgage Type
VA
Estimated Equity
$217,528
Purchase Details
Closed on
Jul 22, 2009
Sold by
Sf Communities Llc
Bought by
Ross Eric L
Home Financials for this Owner
Home Financials are based on the most recent Mortgage that was taken out on this home.
Original Mortgage
$168,565
Outstanding Balance
$111,240
Interest Rate
5.53%
Mortgage Type
VA
Estimated Equity
$217,528
Purchase Details
Closed on
May 4, 2009
Sold by
Faith & Pounds Llc
Bought by
Sf Communities Llc
Home Financials for this Owner
Home Financials are based on the most recent Mortgage that was taken out on this home.
Original Mortgage
$126,424
Interest Rate
4.79%
Mortgage Type
Construction
Create a Home Valuation Report for This Property
The Home Valuation Report is an in-depth analysis detailing your home's value as well as a comparison with similar homes in the area
Home Values in the Area
Average Home Value in this Area
Purchase History
| Date | Buyer | Sale Price | Title Company |
|---|---|---|---|
| Ross Eric L | -- | None Available | |
| Ross Eric L | $168,600 | None Available | |
| Sf Communities Llc | $24,000 | None Available |
Source: Public Records
Mortgage History
| Date | Status | Borrower | Loan Amount |
|---|---|---|---|
| Open | Ross Eric L | $168,565 | |
| Previous Owner | Sf Communities Llc | $126,424 |
Source: Public Records
Tax History Compared to Growth
Tax History
| Year | Tax Paid | Tax Assessment Tax Assessment Total Assessment is a certain percentage of the fair market value that is determined by local assessors to be the total taxable value of land and additions on the property. | Land | Improvement |
|---|---|---|---|---|
| 2024 | -- | $109,520 | $14,000 | $95,520 |
| 2023 | $0 | $102,520 | $14,000 | $88,520 |
| 2022 | $2,982 | $90,440 | $14,000 | $76,440 |
| 2021 | $2,407 | $72,320 | $10,000 | $62,320 |
| 2020 | $2,037 | $61,200 | $8,800 | $52,400 |
| 2019 | $2,037 | $61,200 | $8,800 | $52,400 |
| 2018 | $0 | $61,720 | $8,800 | $52,920 |
| 2017 | $1,435 | $61,720 | $8,800 | $52,920 |
| 2016 | $1,437 | $61,720 | $8,800 | $52,920 |
| 2015 | -- | $61,720 | $8,800 | $52,920 |
| 2014 | -- | $61,720 | $8,800 | $52,920 |
| 2013 | -- | $61,720 | $8,800 | $52,920 |
Source: Public Records
Map
Nearby Homes
- 104 Rodney Dr
- 716 Broderick Cir
- Lot 5 Broderick Cir
- Lot 9 Broderick Cir
- Lot 23 Broderick Cir
- Lot 33 Broderick Cir
- 0 Broderick Cir Unit 7080917
- 0 Broderick Cir Unit 7027632
- 0 Broderick Cir Unit 8699480
- 0 Broderick Cir Unit 8518903
- 0 Broderick Cir Unit 8435153
- 0 Broderick Cir Unit 7283118
- 0 Broderick Cir Unit 8946860
- 0 Broderick Cir Unit 9000027
- 0 Broderick Cir Unit 8999963
- 0 Broderick Cir Unit 9000658
- 0 Broderick Cir Unit 9001016
- 0 Broderick Cir Unit 9018688
- 0 Broderick Cir Unit 9000100
- 0 Broderick Cir Unit 8998417