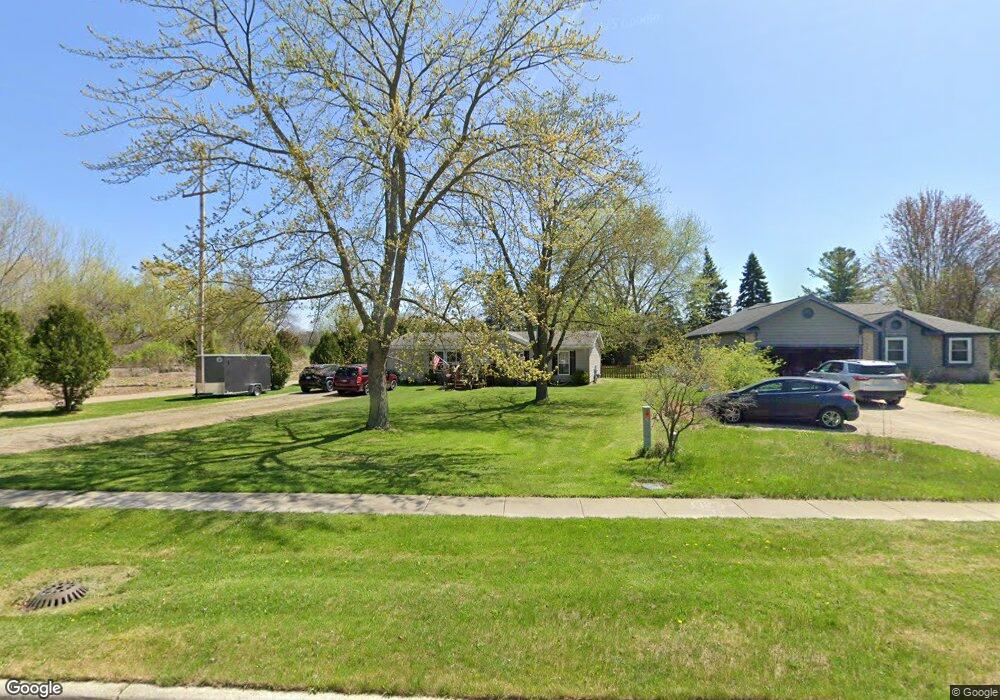
718 Cherry St Unit Bldg-Unit Linden, MI 48451
Estimated Value: $241,771 - $289,000
3
Beds
2
Baths
1,296
Sq Ft
$202/Sq Ft
Est. Value
About This Home
This home is located at 718 Cherry St Unit Bldg-Unit, Linden, MI 48451 and is currently estimated at $261,693, approximately $201 per square foot. 718 Cherry St Unit Bldg-Unit is a home located in Genesee County with nearby schools including Linden Elementary School, Linden Middle School, and Linden High School.
Ownership History
Date
Name
Owned For
Owner Type
Purchase Details
Closed on
Feb 16, 2018
Sold by
Roesch Joseph R and Roesch Jamie A
Bought by
Bearup Tanya Irene and Bearup Roger Eli
Current Estimated Value
Home Financials for this Owner
Home Financials are based on the most recent Mortgage that was taken out on this home.
Original Mortgage
$113,960
Outstanding Balance
$96,221
Interest Rate
3.87%
Mortgage Type
FHA
Estimated Equity
$165,472
Purchase Details
Closed on
Jun 19, 2015
Sold by
Kingston Eric and Kingston Amanda
Bought by
Roesch Joseph R and Greg Jamie A
Home Financials for this Owner
Home Financials are based on the most recent Mortgage that was taken out on this home.
Original Mortgage
$69,000
Interest Rate
3.82%
Mortgage Type
New Conventional
Purchase Details
Closed on
Jul 8, 2005
Sold by
Copeland Anthony D and Copeland Kerri L
Bought by
Kingston Eric and Ellery Amanda
Home Financials for this Owner
Home Financials are based on the most recent Mortgage that was taken out on this home.
Original Mortgage
$113,100
Interest Rate
5.69%
Mortgage Type
FHA
Create a Home Valuation Report for This Property
The Home Valuation Report is an in-depth analysis detailing your home's value as well as a comparison with similar homes in the area
Home Values in the Area
Average Home Value in this Area
Purchase History
| Date | Buyer | Sale Price | Title Company |
|---|---|---|---|
| Bearup Tanya Irene | $122,000 | First American Title Ins Co | |
| Roesch Joseph R | $94,000 | Title Resource Agency | |
| Kingston Eric | $114,000 | Cislo Title Co |
Source: Public Records
Mortgage History
| Date | Status | Borrower | Loan Amount |
|---|---|---|---|
| Open | Bearup Tanya Irene | $113,960 | |
| Previous Owner | Roesch Joseph R | $69,000 | |
| Previous Owner | Kingston Eric | $113,100 |
Source: Public Records
Tax History
| Year | Tax Paid | Tax Assessment Tax Assessment Total Assessment is a certain percentage of the fair market value that is determined by local assessors to be the total taxable value of land and additions on the property. | Land | Improvement |
|---|---|---|---|---|
| 2025 | $3,330 | $100,900 | $0 | $0 |
| 2024 | $1,973 | $90,200 | $0 | $0 |
| 2023 | $2,029 | $75,200 | $0 | $0 |
| 2022 | $3,064 | $66,800 | $0 | $0 |
| 2021 | $2,667 | $64,100 | $0 | $0 |
| 2020 | $1,848 | $62,100 | $0 | $0 |
| 2019 | $2,197 | $71,200 | $0 | $0 |
| 2018 | $2,676 | $71,200 | $0 | $0 |
| 2017 | $2,594 | $63,000 | $0 | $0 |
| 2016 | $2,632 | $63,000 | $0 | $0 |
| 2015 | $1,838 | $56,900 | $0 | $0 |
| 2012 | -- | $43,649 | $43,649 | $0 |
Source: Public Records
Map
Nearby Homes
- 712 Bush St
- 331 Andrea Ave Unit 63
- 231 Kathy Cir Unit 43
- 532 E Broad St
- 14238 Durant St
- 4468 Edison Blvd Unit 50
- 4453 Ford Ave
- 4448 Ford Ave
- 4447 Edison Blvd
- 4437 Edison Blvd
- 14247 Webster Dr
- 394 Saddlebrook Dr
- 14270 Wright Dr
- 5194 Amelia Earhart Dr
- 5202 Amelia Earhart Dr
- 5220 Amelia Earhart Dr
- 15051 Poberezny Ct
- 5465 Red Oak Ct Unit 20
- 513 W Broad St
- 0 Silver Lake Rd Unit 20251009849
- 718 Cherry St
- 708 Cherry St
- 704 Cherry St
- 727 Riverside Dr
- 723 Riverside Dr
- 719 Riverside Dr
- 707 Cherry St
- 620 Cherry St
- 711 Cherry St
- 600 Cherry St
- 715 Riverside Dr
- 621 Cherry St
- 703 Cherry St
- 277 Laura Ln Unit 37
- 269 Laura Ln Unit 36
- 711 Riverside Dr
- 285 Laura Ln Unit 38
- 519 Cherry St
- 261 Laura Ln Unit 35
- 728 Riverside Dr
Your Personal Tour Guide
Ask me questions while you tour the home.